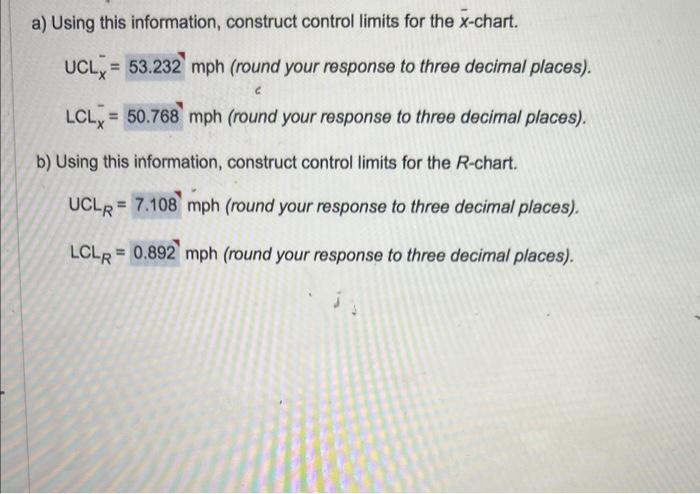
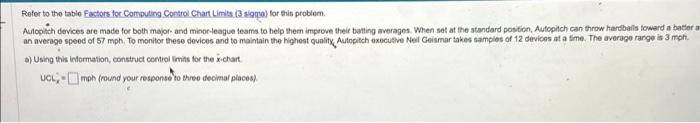
Question: a) Using this information, construct control limits for the x-chart. UCLx=LCLx=mph(roundyourresponsetothreedecimalplaces).mph(roundyourresponsetothreedecimalplaces). b) Using this information, construct control limits for the R-chart. UCLR=7.108mph (round your response

a) Using this information, construct control
a) Using this information, construct control limits for the x-chart. UCLx=LCLx=mph(roundyourresponsetothreedecimalplaces).mph(roundyourresponsetothreedecimalplaces). b) Using this information, construct control limits for the R-chart. UCLR=7.108mph (round your response to three decimal places). LCLR=0.892mph (round your response to three decimal places). Fofer to the tabie Factors for Computing Control Chart Limits (3 sigmol for this problem. a) Using this information, construct control limits for the x-chart UCL. x= mph (round your response to three decimal places). Data Table

Step by Step Solution

There are 3 Steps involved in it

1 Expert Approved Answer
Step: 1 Unlock blur-text-image
Question Has Been Solved by an Expert!

Get step-by-step solutions from verified subject matter experts

Step: 2 Unlock
Step: 3 Unlock

Students Have Also Explored These Related General Management Questions!