

Question: a. Without using your notes, fill in phase diagram below: label appropriate phases of water present under given pressure and temperature conditions. 217.8 log Pressure
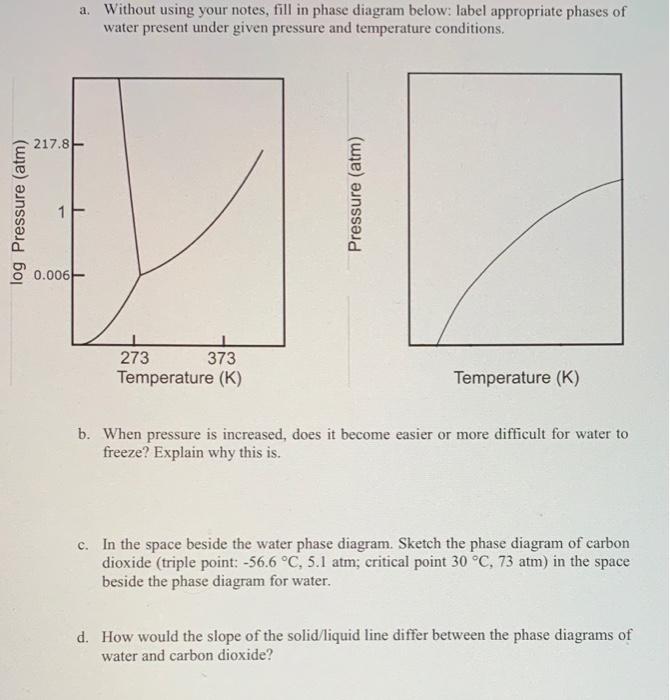
a. Without using your notes, fill in phase diagram below: label appropriate phases of water present under given pressure and temperature conditions. 217.8 log Pressure (atm) Pressure (atm) 0.006 273 373 Temperature (K) Temperature (K) b. When pressure is increased, does it become easier or more difficult for water to freeze? Explain why this is. c. In the space beside the water phase diagram. Sketch the phase diagram of carbon dioxide (triple point: -56.6 C, 5.1 atm; critical point 30 C, 73 atm) in the space beside the phase diagram for water. d. How would the slope of the solid liquid line differ between the phase diagrams of water and carbon dioxide? e. Compare the strength of the intermolecular forces in water and carbon dioxide. Use the graphs in (a) and (b) to support your answer. f. Now use this page to draw potential energy curves for the intermolecular forces between water molecules and carbon dioxide molecules. Use appropriate energy scales. You may approximate those values. a. Without using your notes, fill in phase diagram below: label appropriate phases of water present under given pressure and temperature conditions. 217.8 log Pressure (atm) Pressure (atm) 0.006 273 373 Temperature (K) Temperature (K) b. When pressure is increased, does it become easier or more difficult for water to freeze? Explain why this is. c. In the space beside the water phase diagram. Sketch the phase diagram of carbon dioxide (triple point: -56.6 C, 5.1 atm; critical point 30 C, 73 atm) in the space beside the phase diagram for water. d. How would the slope of the solid liquid line differ between the phase diagrams of water and carbon dioxide? e. Compare the strength of the intermolecular forces in water and carbon dioxide. Use the graphs in (a) and (b) to support your answer. f. Now use this page to draw potential energy curves for the intermolecular forces between water molecules and carbon dioxide molecules. Use appropriate energy scales. You may approximate those values
Step by Step Solution
There are 3 Steps involved in it

Get step-by-step solutions from verified subject matter experts