

Question: a) Write the estimated regression equation from the coefficient output and interpret the results. (150 words) Regression Output Standardized Unstandardized Coefficients Coefficients Mode B Std.
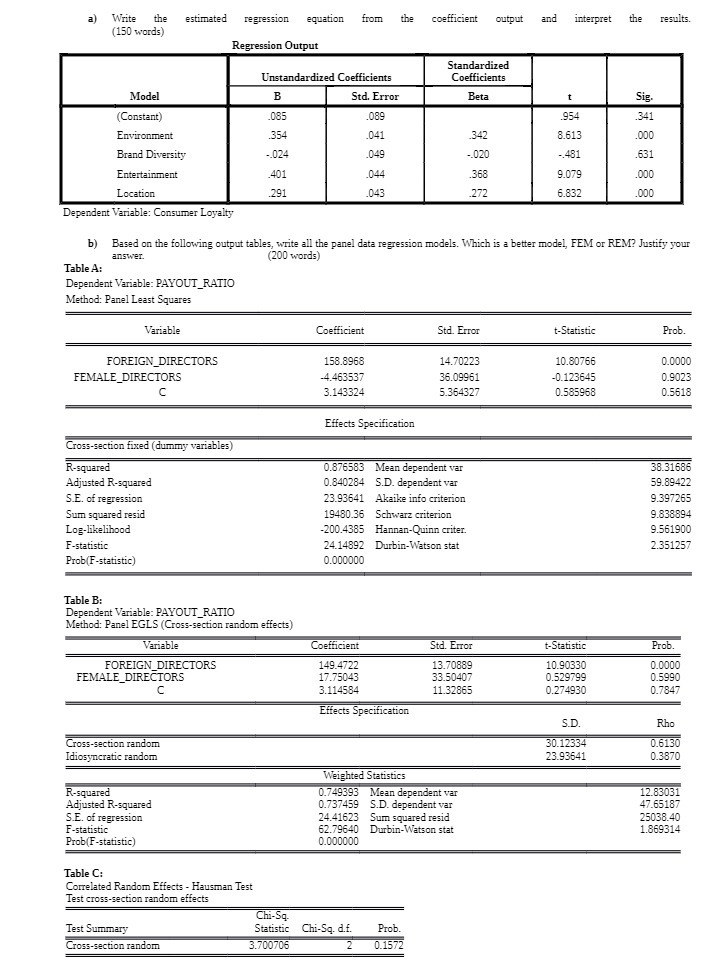
a) Write the estimated regression equation from the coefficient output and interpret the results. (150 words) Regression Output Standardized Unstandardized Coefficients Coefficients Mode B Std. Error Beta Sig. Constant) 085 089 954 341 Environment 354 .041 .342 8.613 .000 Brand Diversity 074 .049 .020 .481 .631 Entertainment 401 .044 .368 9.079 .000 Location .291 .043 272 6.832 .000 Dependent Variable: Consumer Loyalty b) Based on the following output tables, write all the panel data regression models. Which is a better model, FEM or REM? Justify your answer. (200 words) Table A: Dependent Variable: PAYOUT_RATIO Method: Panel Least Squares Variable Coefficient Std. Error t-Statistic Prob FOREIGN_DIRECTORS 158.8968 14.70223 10.80766 0.0000 FEMALE_DIRECTORS -4.463537 36.09961 -0.123645 0.9023 C 3.143324 5.364327 0.585968 0.5618 Effects Specification Cross-section fixed (dummy variables) R-squared 0.876583 Mean dependent var 38.31686 Adjusted R-squared 0.840284 S.D. dependent var 59.89422 S.E. of regression 23.93641 Akaike info criterion 9.397265 Sum squared resid 19480.36 Schwarz criterion 9.838894 Log-likelihood -200.4385 Hannan-Quinn criter. 9.561900 F-statistic 24.14892 Durbin-Watson stat 2.351257 Prob(F-statistic) 0.000000 Table B: Dependent Variable: PAYOUT_RATIO Method: Panel EGLS (Cross-section random effects) Variable Coefficient Std. Error t-Statistic Prob FOREIGN_DIRECTORS 149.4722 13.70889 10.90330 0.0000 FEMALE_DIRECTORS 17.75043 33.50407 0.529799 0.5990 C 3.114584 11.32865 0.274930 0.7847 Effects Specification 5.D. Rho Cross-section random 30.12334 0.6130 Idiosyncratic random 23.93541 0.3870 Weighted Statistics R-squared 0.749393 Mean dependent var 12.83031 Adjusted R-squared 0.737459 5.D. dependent var 47.65187 S.E. of regression 24.41623 Sum squared resid 25038.40 F-statistic 62.79640 Durbin-Watson stat 1.869314 Prob(F-statistic) 0.000000 Table C: Correlated Random Effects - Hausman Test Test cross-section random effects Chi-5q Test Summary Statistic Chi-Sq. d.f. Prob Cross-section random 8.70070 0.1572
Step by Step Solution
There are 3 Steps involved in it

Get step-by-step solutions from verified subject matter experts