

Question: Create a line graph using excel: a) x axis being the concentration (M) and the y axis labeled percent difference of mass (%) and title
Create a line graph using excel:
a) x axis being the concentration (M) and the y axis labeled percent difference of mass (%) and title of the graph: Estimating the Isomotic Point in Potato Cores.
b) include vertical error bars to the line graph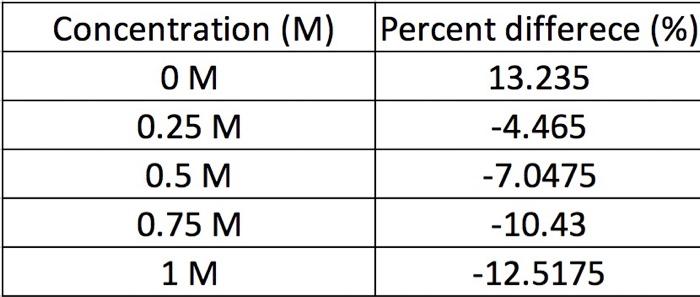
Concentration (M) Percent differece (%) 0.25 M 0.5 M 0.75 M 1 M 13.235 -4.465 -7.0475 -10.43 -12.5175
Step by Step Solution
★★★★★
3.39 Rating (155 Votes )
There are 3 Steps involved in it
1 Expert Approved Answer
Step: 1 Unlock

Enter the data Draw the line graph Adding Vertic... View full answer
Question Has Been Solved by an Expert!
Get step-by-step solutions from verified subject matter experts
Step: 2 Unlock
Step: 3 Unlock