

Question: AA 02-03 Global Analysis LO A2 Key comparative figures for Apple, Google, and Samsung follow. Samsung In millions Current Year Total liabilities W87,260,662 Total
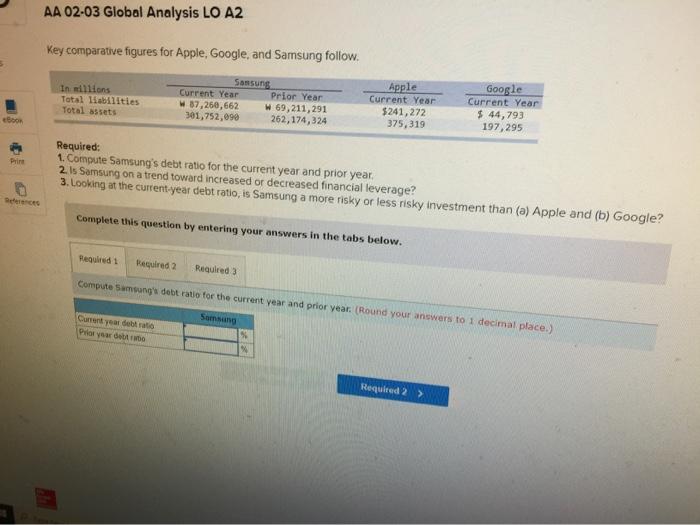
AA 02-03 Global Analysis LO A2 Key comparative figures for Apple, Google, and Samsung follow. Samsung In millions Current Year Total liabilities W87,260,662 Total assets 301,752,090 Prior Year W 69,211,291 262,174,324 eBook Required: Apple Current Year $241,272 375,319 Google Current Year $ 44,793 197,295 Prin References 1. Compute Samsung's debt ratio for the current year and prior year. 2. Is Samsung on a trend toward increased or decreased financial leverage? 3. Looking at the current-year debt ratio, is Samsung a more risky or less risky investment than (a) Apple and (b) Google? Complete this question by entering your answers in the tabs below. Required 1 Required 2 Required 3 Compute Samsung's debt ratio for the current year and prior year. (Round your answers to 1 decimal place.) Current year debt ratio Samsung Prior year debt rabo Required 2>>
Step by Step Solution
There are 3 Steps involved in it

Get step-by-step solutions from verified subject matter experts