

Question: AA 09-2 Comparative Analysis LO A1 Key figures for Apple and Google follow. $ millions Net income Income taxes Interest expense Current Year $ 48,351
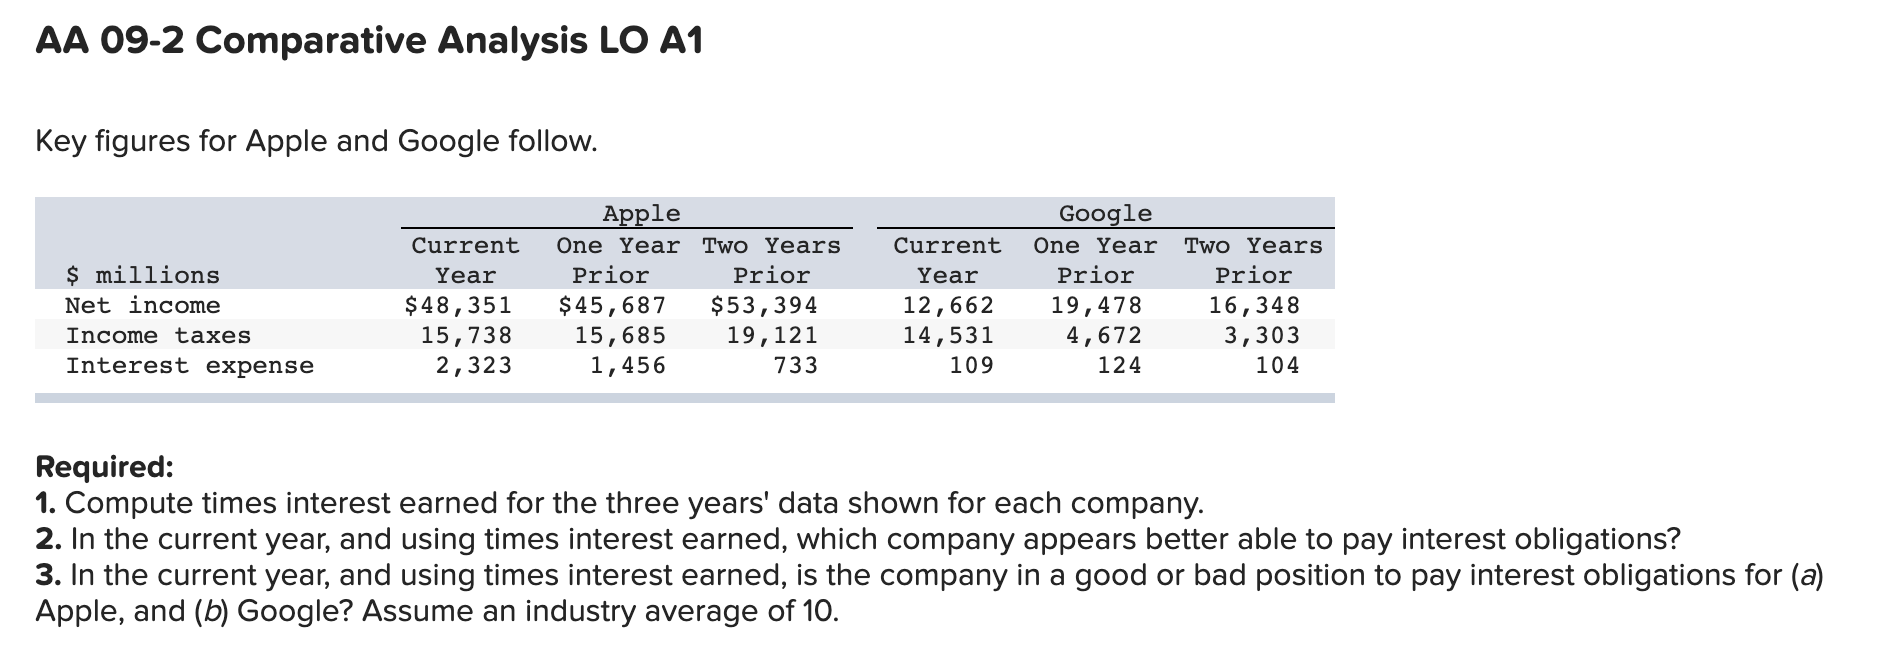
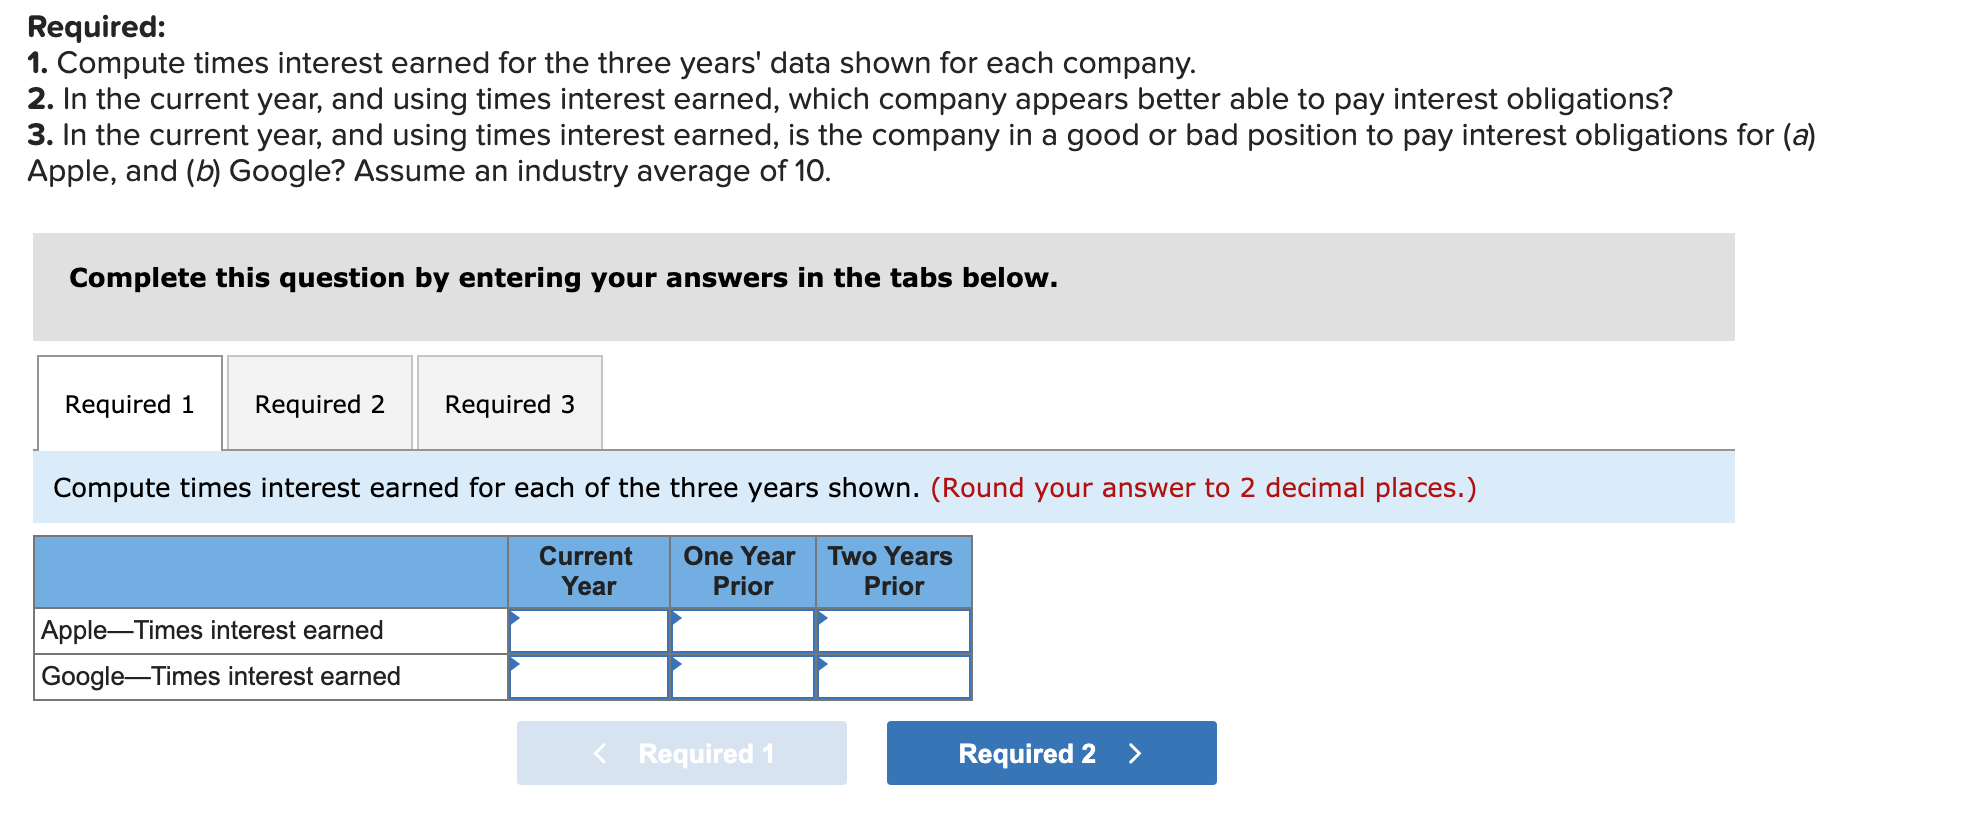
AA 09-2 Comparative Analysis LO A1 Key figures for Apple and Google follow. $ millions Net income Income taxes Interest expense Current Year $ 48,351 15,738 2,323 Apple One Year Two Years Prior Prior $45,687 $53,394 15,685 19,121 1,456 733 Current Year 12,662 14,531 109 Google One Year Prior 19,478 4,672 124 Two Years Prior 16,348 3,303 104 Required: 1. Compute times interest earned for the three years' data shown for each company. 2. In the current year, and using times interest earned, which company appears better able to pay interest obligations? 3. In the current year, and using times interest earned, is the company in a good or bad position to pay interest obligations for (a) Apple, and (b) Google? Assume an industry average of 10. Required: 1. Compute times interest earned for the three years' data shown for each company. 2. In the current year, and using times interest earned, which company appears better able to pay interest obligations? 3. In the current year, and using times interest earned, is the company in a good or bad position to pay interest obligations for (a) Apple, and (b) Google? Assume an industry average of 10. Complete this question by entering your answers in the tabs below. Required 1 Required 2 Required 3 Compute times interest earned for each of the three years shown. (Round your answer to 2 decimal places.) Current Year One Year Prior Two Years Prior AppleTimes interest earned GoogleTimes interest earned
Step by Step Solution
There are 3 Steps involved in it

Get step-by-step solutions from verified subject matter experts