

Question: AA 2-3 Global Analysis LO A2 Key comparative figures for Apple, Google, and Samsung follow. In millions Total Liabilities Total assets Required: Current Year
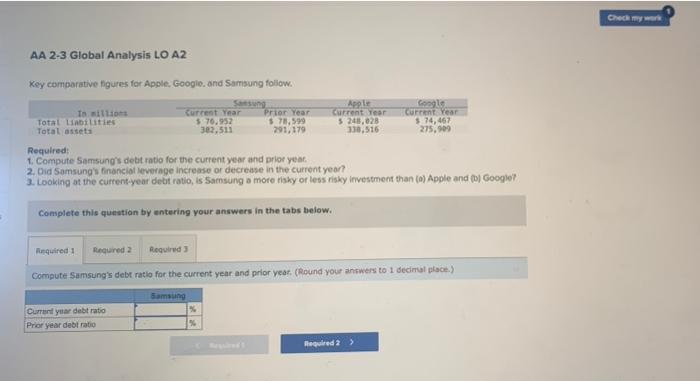
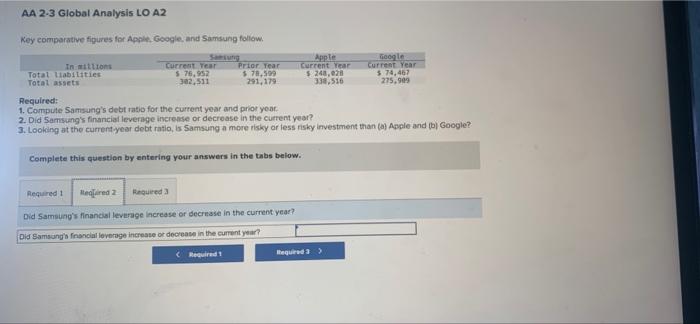
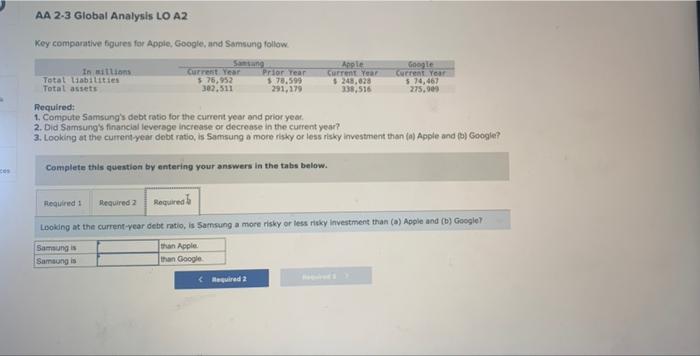
AA 2-3 Global Analysis LO A2 Key comparative figures for Apple, Google, and Samsung follow. In millions Total Liabilities Total assets Required: Current Year $76,952 382,511 Prior Year $78,599 291,179 1. Compute Samsung's debt ratio for the current year and prior year. Apple Current Year $ 248,028 338,516 Google Current Year $ 74,467 275,909 2. Did Samsung's financial leverage increase or decrease in the current year? 3. Looking at the current-year debt ratio, is Samsung a more risky or less risky investment than (a) Apple and (b) Google? Complete this question by entering your answers in the tabs below. Required 1 Required 2 Required 3 Compute Samsung's debt ratio for the current year and prior year. (Round your answers to 1 decimal place.) Current year debt ratio Prior year debt ratio Samsung 1 Regtred Required 2> Check my work
Step by Step Solution
There are 3 Steps involved in it

Get step-by-step solutions from verified subject matter experts