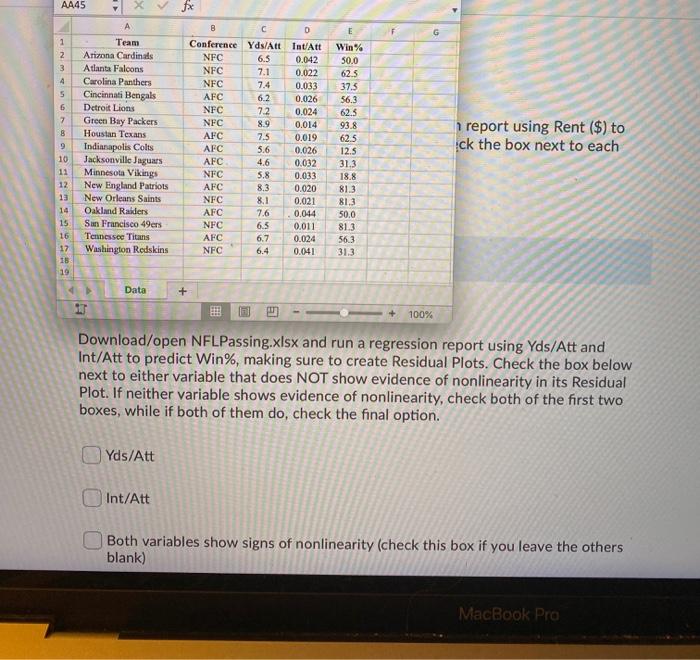
Question: AA45 fx A B D G 1 2 3 4 5 6 Team Anna Cardinals Atlanta Falcons Carolina Panthers Cincinnati Bengals Detroit Lions Green Bay

AA45 fx A B D G 1 2 3 4 5 6 Team Anna Cardinals
AA45 fx A B D G 1 2 3 4 5 6 Team Anna Cardinals Atlanta Falcons Carolina Panthers Cincinnati Bengals Detroit Lions Green Bay Packers Houstan Texans Indianapolis Colts Jacksonville Jaguars Minnesota Vikings New England Patriots New Orleans Saints Oakland Raiders Sun Francisco 49ers Tennessee Titans Washington Redskins 7 8 9 10 11 12 13 14 15 16 17 15 Conference Yds/Att NFC 6.5 NFC 7.1 NFC 7.4 AFC 6.2 NFC 72 NFC 8.9 AFC 7.5 AFC 5.6 AFC 4.6 NFC 5.8 AFC 8.3 NFC 8.1 AFC 7.6 NFC 6.5 AFC 6.7 NFC 6.4 Int'Att 0.042 0.022 0.033 0.026 0.024 0.014 0.019 0.026 0.032 0.033 0.020 0.021 0.044 0.011 0.024 0.041 Win% 50.0 62.5 37.5 56.3 625 93.8 62.5 12.5 31.3 18.8 81.3 81.3 50.0 81.3 563 31.3 1 report using Rent ($) to ck the box next to each Data + 100% Download/open NFLPassing.xlsx and run a regression report using Yds/Att and Int/Att to predict Win%, making sure to create Residual Plots. Check the box below next to either variable that does NOT show evidence of nonlinearity in its Residual Plot. If neither variable shows evidence of nonlinearity, check both of the first two boxes, while if both of them do, check the final option. Yds/Att Int/Att Both variables show signs of nonlinearity (check this box if you leave the others blank) MacBook Pro AA45 fx A B D G 1 2 3 4 5 6 Team Anna Cardinals Atlanta Falcons Carolina Panthers Cincinnati Bengals Detroit Lions Green Bay Packers Houstan Texans Indianapolis Colts Jacksonville Jaguars Minnesota Vikings New England Patriots New Orleans Saints Oakland Raiders Sun Francisco 49ers Tennessee Titans Washington Redskins 7 8 9 10 11 12 13 14 15 16 17 15 Conference Yds/Att NFC 6.5 NFC 7.1 NFC 7.4 AFC 6.2 NFC 72 NFC 8.9 AFC 7.5 AFC 5.6 AFC 4.6 NFC 5.8 AFC 8.3 NFC 8.1 AFC 7.6 NFC 6.5 AFC 6.7 NFC 6.4 Int'Att 0.042 0.022 0.033 0.026 0.024 0.014 0.019 0.026 0.032 0.033 0.020 0.021 0.044 0.011 0.024 0.041 Win% 50.0 62.5 37.5 56.3 625 93.8 62.5 12.5 31.3 18.8 81.3 81.3 50.0 81.3 563 31.3 1 report using Rent ($) to ck the box next to each Data + 100% Download/open NFLPassing.xlsx and run a regression report using Yds/Att and Int/Att to predict Win%, making sure to create Residual Plots. Check the box below next to either variable that does NOT show evidence of nonlinearity in its Residual Plot. If neither variable shows evidence of nonlinearity, check both of the first two boxes, while if both of them do, check the final option. Yds/Att Int/Att Both variables show signs of nonlinearity (check this box if you leave the others blank) MacBook Pro

Step by Step Solution

There are 3 Steps involved in it

1 Expert Approved Answer
Step: 1 Unlock blur-text-image
Question Has Been Solved by an Expert!

Get step-by-step solutions from verified subject matter experts

Step: 2 Unlock
Step: 3 Unlock

Students Have Also Explored These Related General Management Questions!