Question: I have attached all information that I was given. please help The National Football League (NFL) records a variety of performance data for individuals and
 I have attached all information that I was given. please help
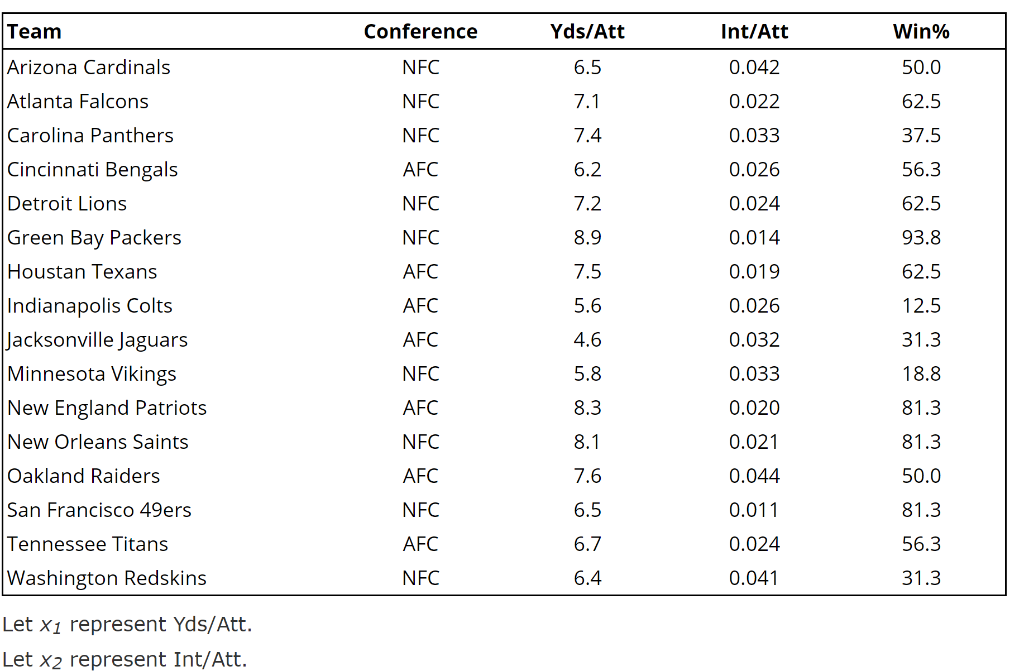
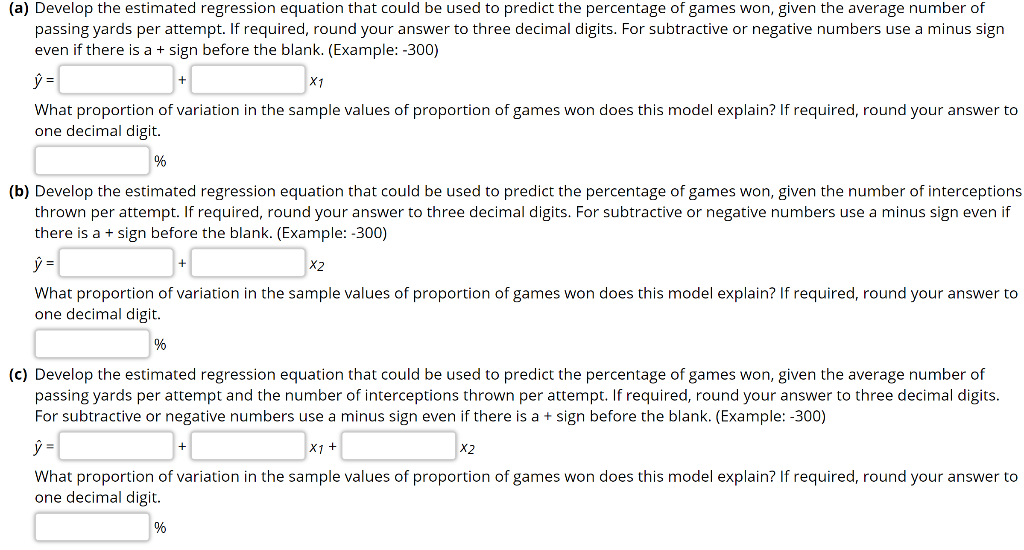
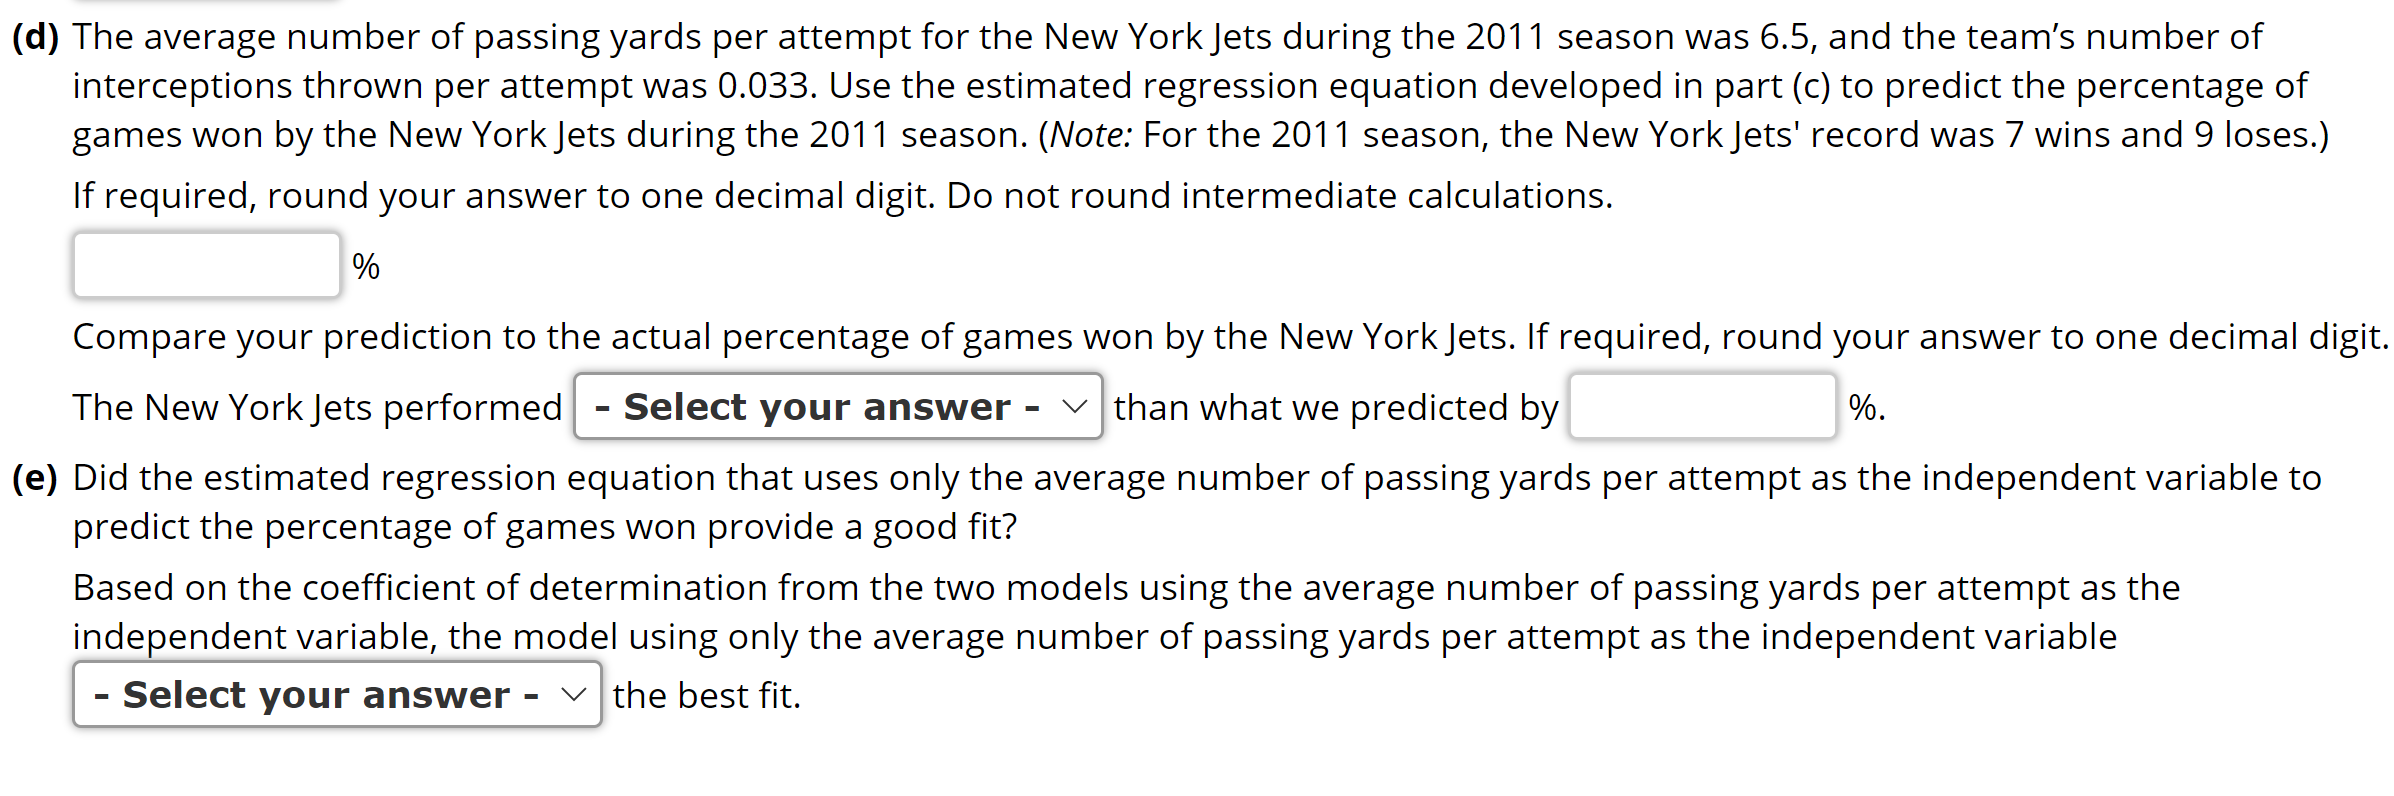
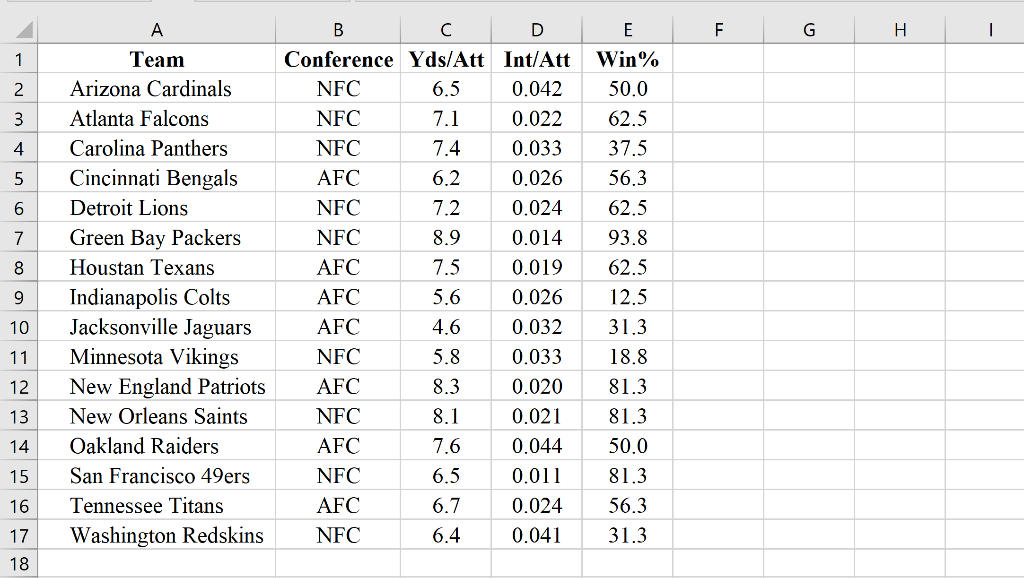
The National Football League (NFL) records a variety of performance data for individuals and teams. To investigate the importance of passing on the percentage of games won by a team, the following data show the conference (Conf), average number of passing yards per attempt (Yds/Att), the number of interceptions thrown per attempt (Int/Att), and the percentage of games won (Win%) for a random sample of 16 NFL teams for the 2011 season (NFL web site, February 12, 2012). Click on the datafile logo to reference the data. Team Conference Yds/Att Int/Att Win% Arizona Cardinals NFC 6.5 0.042 50.0 NFC 7.1 0.022 62.5 Atlanta Falcons Carolina Panthers NFC 7.4 0.033 37.5 Cincinnati Bengals AFC 6.2 0.026 56.3 Detroit Lions NFC 7.2 0.024 62.5 NFC 8.9 0.014 93.8 AFC 0.019 62.5 7.5 5.6 AFC 0.026 12.5 AFC 4.6 0.032 31.3 Green Bay Packers Houstan Texans Indianapolis Colts Jacksonville Jaguars Minnesota Vikings New England Patriots New Orleans Saints Oakland Raiders NFC 5.8 0.033 18.8 8.3 AFC NFC 0.020 0.021 81.3 81.3 8.1 AFC 7.6 0.044 50.0 San Francisco 49ers NFC 6.5 0.011 81.3 Tennessee Titans AFC 6.7 0.024 56.3 Washington Redskins NFC 6.4 0.041 31.3 Let X1 represent Yds/Att. Let x2 represent Int/Att. (a) Develop the estimated regression equation that could be used to predict the percentage of games won, given the average number of passing yards per attempt. If required, round your answer to three decimal digits. For subtractive or negative numbers use a minus sign even if there is a + sign before the blank. (Example: -300) = What proportion of variation in the sample values of proportion of games won does this model explain? If required, round your answer to one decimal digit. X1 % (b) Develop the estimated regression equation that could be used to predict the percentage of games won, given the number of interceptions thrown per attempt. If required, round your answer to three decimal digits. For subtractive or negative numbers use a minus sign even if there is a + sign before the blank. (Example: -300) = What proportion of variation in the sample values of proportion of games won does this model explain? If required, round your answer to one decimal digit. X2 (c) Develop the estimated regression equation that could be used to predict the percentage of games won, given the average number of passing yards per attempt and the number of interceptions thrown per attempt. If required, round your answer to three decimal digits. For subtractive or negative numbers use a minus sign even if there is a + sign before the blank. (Example: -300) X1 What proportion of variation in the sample values of proportion of games won does this model explain? If required, round your answer to one decimal digit. % (d) The average number of passing yards per attempt for the New York Jets during the 2011 season was 6.5, and the team's number of interceptions thrown per attempt was 0.033. Use the estimated regression equation developed in part (c) to predict the percentage of games won by the New York Jets during the 2011 season. (Note: For the 2011 season, the New York Jets' record was 7 wins and 9 loses.) If required, round your answer to one decimal digit. Do not round intermediate calculations. % Compare your prediction to the actual percentage of games won by the New York Jets. If required, round your answer to one decimal digit. The New York Jets performed Select your answer than what we predicted by %. (e) Did the estimated regression equation that uses only the average number of passing yards per attempt as the independent variable to predict the percentage of games won provide a good fit? Based on the coefficient of determination from the two models using the average number of passing yards per attempt as the independent variable, the model using only the average number of passing yards per attempt as the independent variable - Select your answer - v the best fit. E F. G . 1 1 2 6.5 3 4 5 6 7 8 B D Conference Yds/Att Int/Att NFC 0.042 NFC 7.1 0.022 NFC 7.4 0.033 AFC 6.2 0.026 NFC 7.2 0.024 NFC 8.9 0.014 AFC 7.5 0.019 AFC 5.6 0.026 AFC 4.6 0.032 NFC 5.8 0.033 AFC 8.3 0.020 NFC 8.1 0.021 AFC 7.6 0.044 NFC 0.011 AFC 6.7 0.024 NFC 6.4 0.041 Team Arizona Cardinals Atlanta Falcons Carolina Panthers Cincinnati Bengals Detroit Lions Green Bay Packers Houstan Texans Indianapolis Colts Jacksonville Jaguars Minnesota Vikings New England Patriots New Orleans Saints Oakland Raiders San Francisco 49ers Tennessee Titans Washington Redskins 9 Win% 50.0 62.5 37.5 56.3 62.5 93.8 62.5 12.5 31.3 18.8 81.3 81.3 50.0 81.3 56.3 31.3 10 11 12 13 14 15 6.5 16 17 18


