

Question: AaBbCcDdEe AaBbCcDdEe AaBbCcDc AaBbCcDdEE A E Normal No Spacing Heading 1 Heading 2 Paragraph Styles Directions: Demonstrate (show your formulas) and prove your answers. Answer

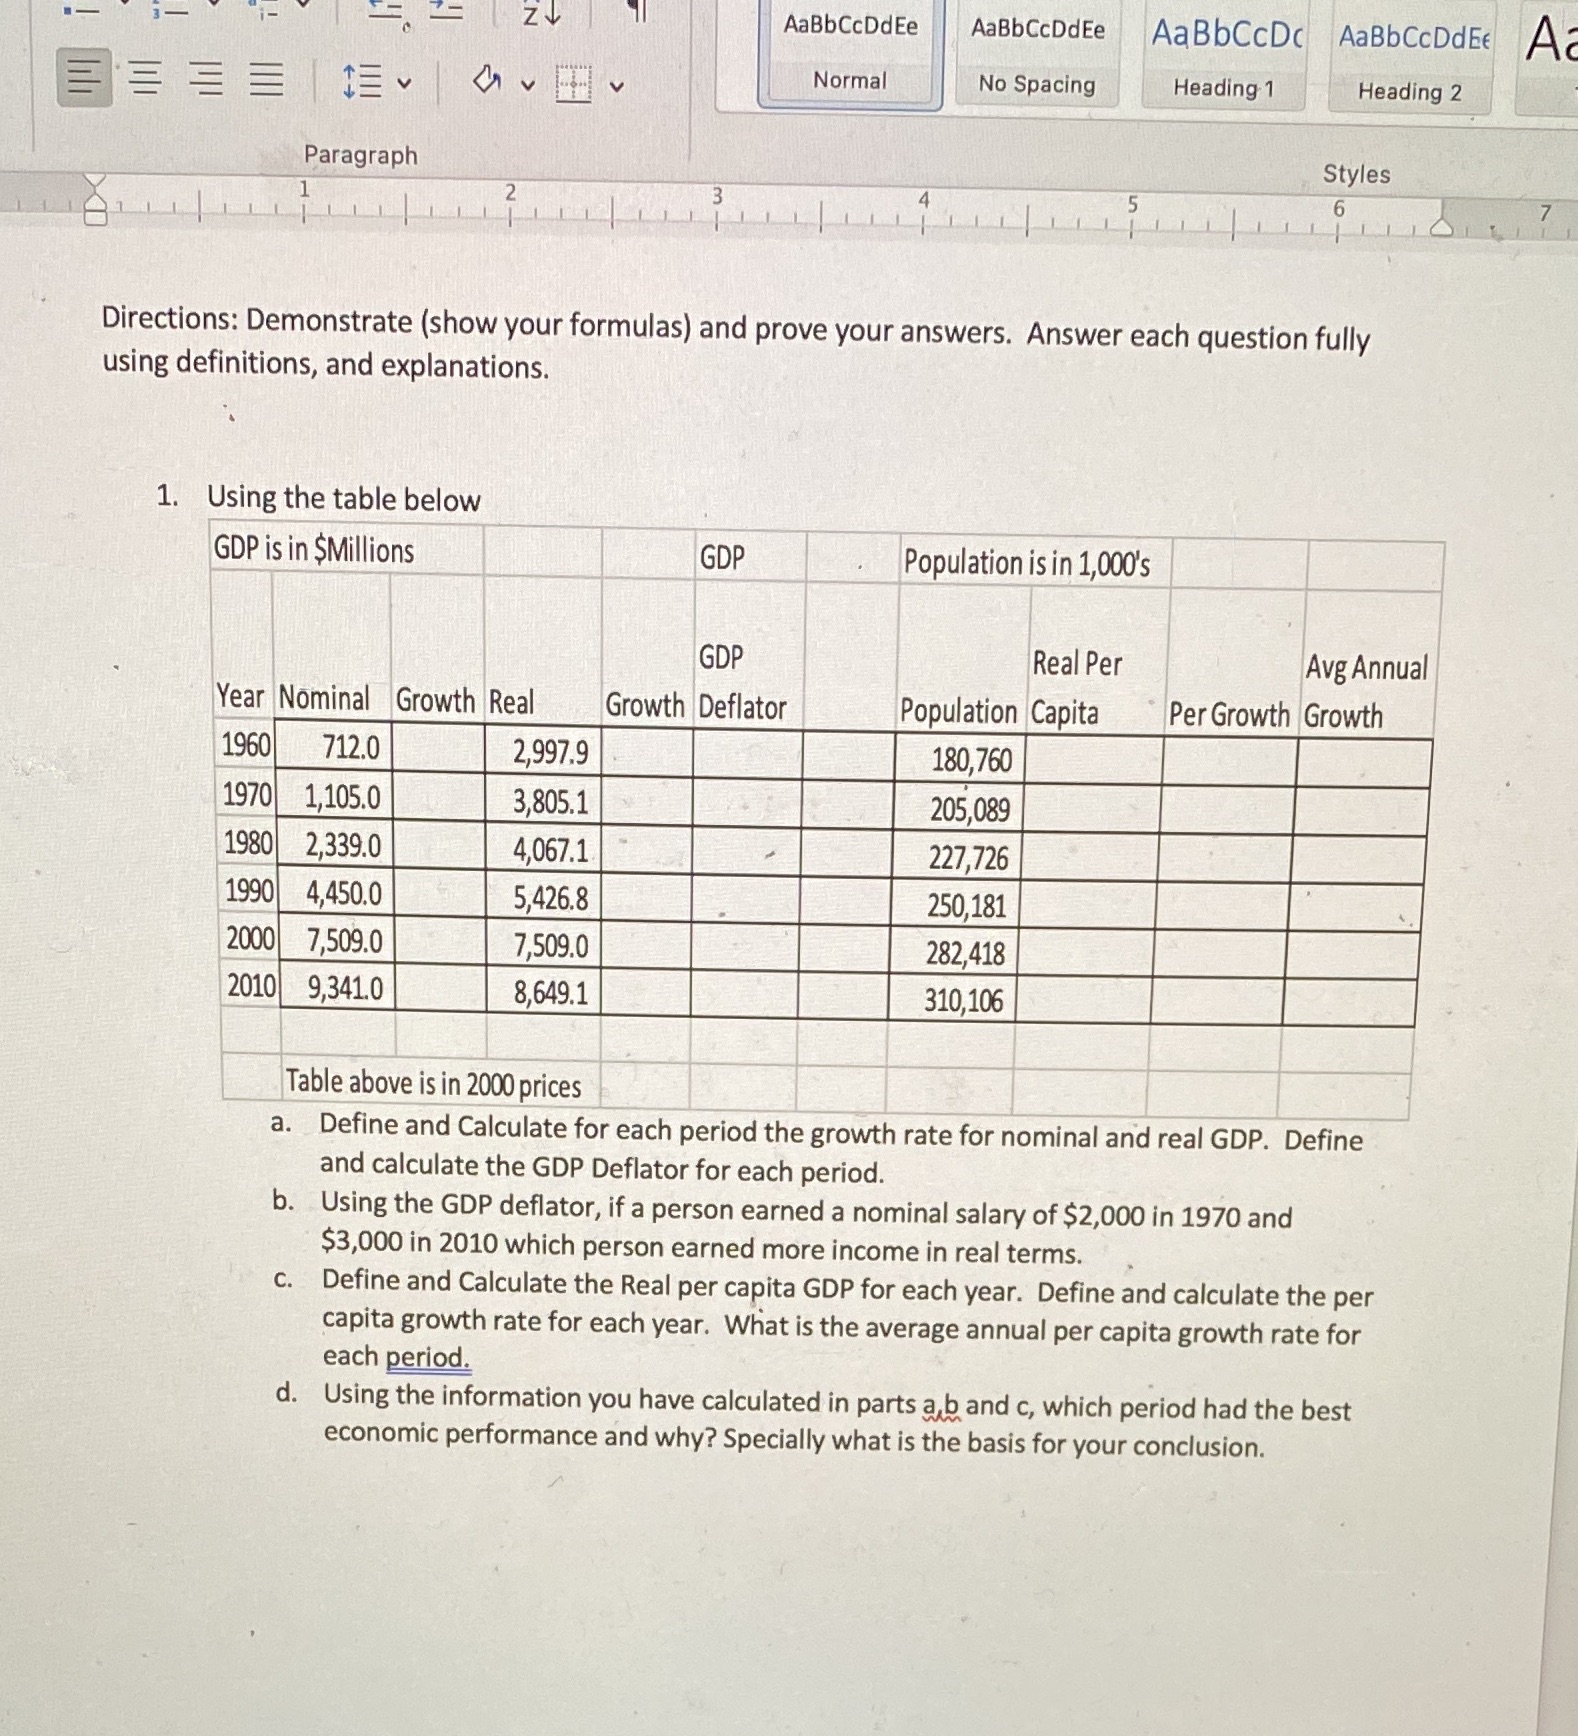
AaBbCcDdEe AaBbCcDdEe AaBbCcDc AaBbCcDdEE A E Normal No Spacing Heading 1 Heading 2 Paragraph Styles Directions: Demonstrate (show your formulas) and prove your answers. Answer each question fully using definitions, and explanations. 1. Using the table below GDP is in $Millions GDP Population is in 1,000's GDP Real Per Avg Annual Year Nominal Growth Real Growth Deflator Population Capita Per Growth Growth 1960 712.0 2,997.9 180,760 1970 1,105.0 3, 805.1 205,089 1980 2,339.0 4,067.1 227,726 1990 4,450.0 5,426.8 250,181 2000 7,509.0 7,509.0 282,418 2010 9,341.0 8,649.1 310,106 Table above is in 2000 prices a. Define and Calculate for each period the growth rate for nominal and real GDP. Define and calculate the GDP Deflator for each period. b. Using the GDP deflator, if a person earned a nominal salary of $2,000 in 1970 and $3,000 in 2010 which person earned more income in real terms. C. Define and Calculate the Real per capita GDP for each year. Define and calculate the per capita growth rate for each year. What is the average annual per capita growth rate for each period. d. Using the information you have calculated in parts a b and c, which period had the best economic performance and why? Specially what is the basis for your conclusion
Step by Step Solution
There are 3 Steps involved in it

Get step-by-step solutions from verified subject matter experts