

Question: AAPL AMZN Monthly Prices MSFT AAP Date adj. prc adj. prc adj. prc Date ret 11/1/2016 25.91 750.57 55.75 11/1/2016 12/1/2016 27.29 749.87 57.88
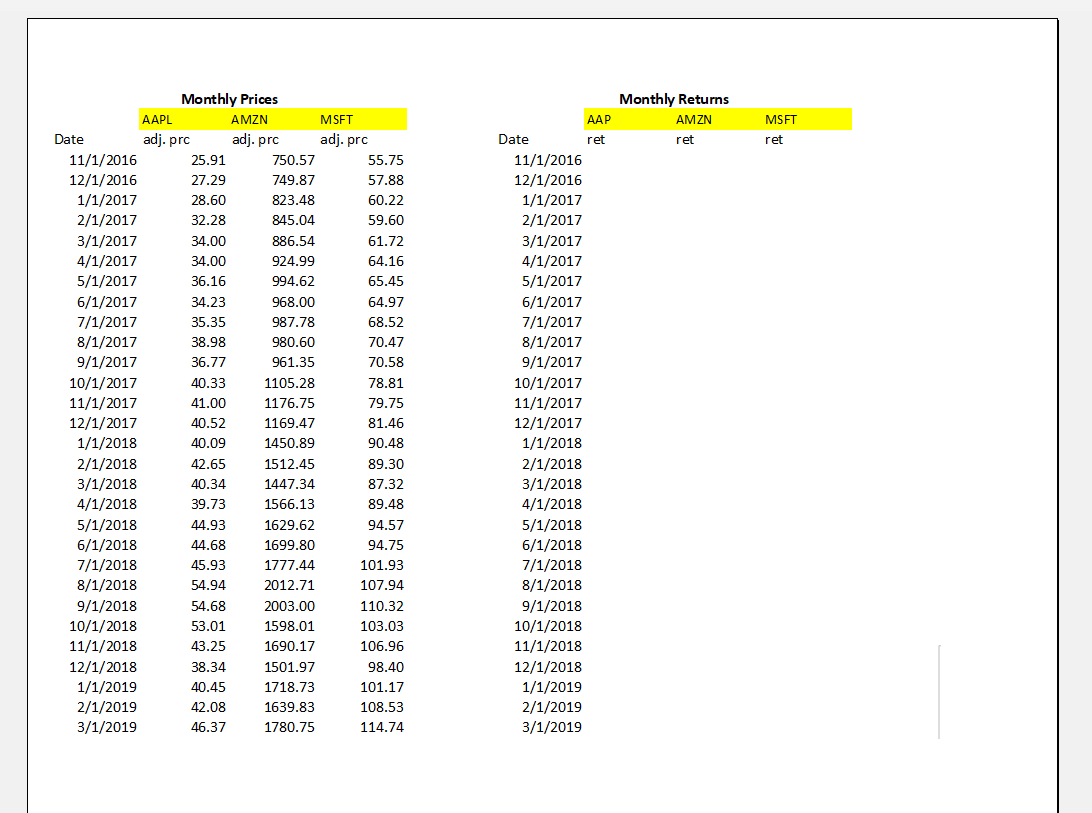
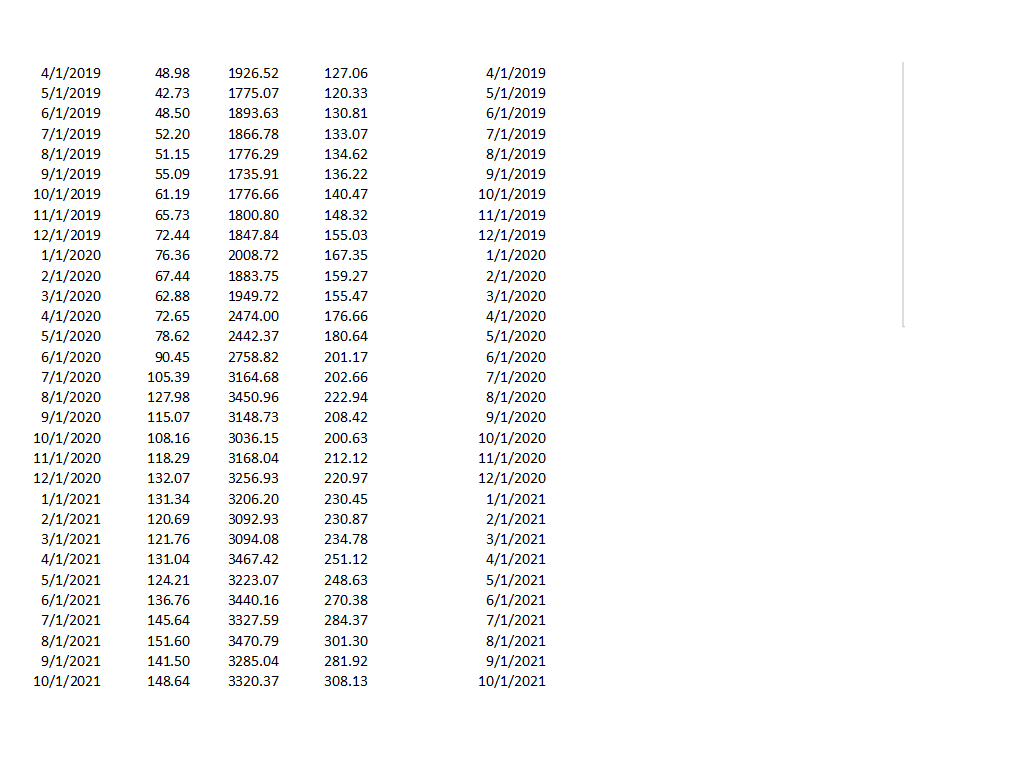
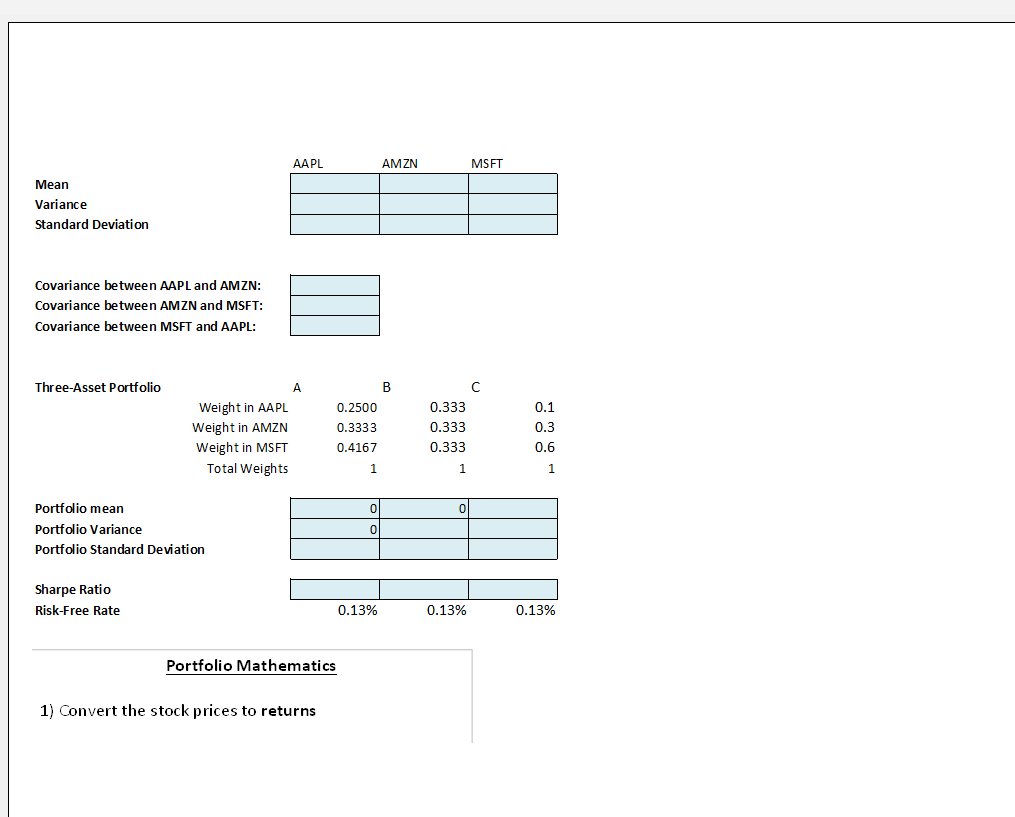
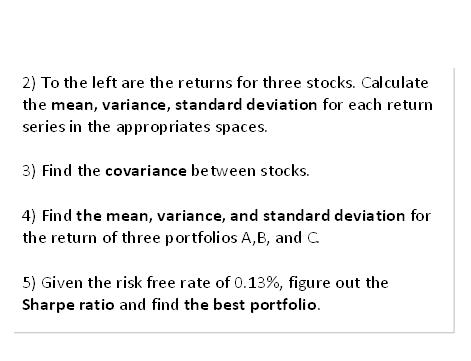
AAPL AMZN Monthly Prices MSFT AAP Date adj. prc adj. prc adj. prc Date ret 11/1/2016 25.91 750.57 55.75 11/1/2016 12/1/2016 27.29 749.87 57.88 12/1/2016 1/1/2017 28.60 823.48 60.22 1/1/2017 2/1/2017 32.28 845.04 59.60 2/1/2017 3/1/2017 34.00 886.54 61.72 3/1/2017 4/1/2017 34.00 924.99 64.16 4/1/2017 5/1/2017 36.16 994.62 65.45 5/1/2017 6/1/2017 34.23 968.00 64.97 6/1/2017 7/1/2017 35.35 987.78 68.52 7/1/2017 8/1/2017 38.98 980.60 70.47 8/1/2017 9/1/2017 36.77 961.35 70.58 9/1/2017 10/1/2017 40.33 1105.28 78.81 10/1/2017 11/1/2017 41.00 1176.75 79.75 11/1/2017 12/1/2017 40.52 1169.47 81.46 12/1/2017 1/1/2018 40.09 1450.89 90.48 1/1/2018 2/1/2018 42.65 1512.45 89.30 2/1/2018 3/1/2018 40.34 1447.34 87.32 3/1/2018 4/1/2018 39.73 1566.13 89.48 4/1/2018 5/1/2018 44.93 1629.62 94.57 5/1/2018 6/1/2018 44.68 1699.80 94.75 6/1/2018 7/1/2018 45.93 1777.44 101.93 7/1/2018 8/1/2018 54.94 2012.71 107.94 8/1/2018 9/1/2018 54.68 2003.00 110.32 9/1/2018 10/1/2018 53.01 1598.01 103.03 10/1/2018 11/1/2018 43.25 1690.17 106.96 11/1/2018 12/1/2018 38.34 1501.97 98.40 12/1/2018 1/1/2019 40.45 1718.73 101.17 1/1/2019 2/1/2019 42.08 1639.83 108.53 2/1/2019 3/1/2019 46.37 1780.75 114.74 3/1/2019 Monthly Returns AMZN ret MSFT ret 4/1/2019 48.98 1926.52 127.06 4/1/2019 5/1/2019 42.73 1775.07 120.33 5/1/2019 6/1/2019 48.50 1893.63 130.81 6/1/2019 7/1/2019 52.20 1866.78 133.07 7/1/2019 8/1/2019 51.15 1776.29 134.62 8/1/2019 9/1/2019 55.09 1735.91 136.22 9/1/2019 10/1/2019 61.19 1776.66 140.47 10/1/2019 11/1/2019 65.73 1800.80 148.32 11/1/2019 12/1/2019 72.44 1847.84 155.03 12/1/2019 1/1/2020 76.36 2008.72 167.35 1/1/2020 2/1/2020 67.44 1883.75 159.27 2/1/2020 3/1/2020 62.88 1949.72 155.47 3/1/2020 4/1/2020 72.65 2474.00 176.66 4/1/2020 5/1/2020 78.62 2442.37 180.64 5/1/2020 6/1/2020 90.45 2758.82 201.17 6/1/2020 7/1/2020 105.39 3164.68 202.66 7/1/2020 8/1/2020 127.98 3450.96 222.94 8/1/2020 9/1/2020 115.07 3148.73 208.42 9/1/2020 10/1/2020 108.16 3036.15 200.63 10/1/2020 11/1/2020 118.29 3168.04 212.12 11/1/2020 12/1/2020 132.07 3256.93 220.97 12/1/2020 1/1/2021 131.34 3206.20 230.45 1/1/2021 2/1/2021 120.69 3092.93 230.87 2/1/2021 3/1/2021 121.76 3094.08 234.78 3/1/2021 4/1/2021 131.04 3467.42 251.12 4/1/2021 5/1/2021 124.21 3223.07 248.63 5/1/2021 6/1/2021 136.76 3440.16 270.38 6/1/2021 7/1/2021 145.64 3327.59 284.37 7/1/2021 8/1/2021 151.60 3470.79 301.30 8/1/2021 9/1/2021 141.50 3285.04 281.92 9/1/2021 10/1/2021 148.64 3320.37 308.13 10/1/2021 Mean Variance Standard Deviation Covariance between AAPL and AMZN: Covariance between AMZN and MSFT: Covariance between MSFT and AAPL: AAPL AMZN MSFT Three-Asset Portfolio A B C Weight in AAPL 0.2500 0.333 0.1 Weight in AMZN 0.3333 0.333 0.3 Weight in MSFT 0.4167 0.333 0.6 Total Weights 1 1 1 Portfolio mean Portfolio Variance 0 0 0 Portfolio Standard Deviation Sharpe Ratio Risk-Free Rate 0.13% 0.13% 0.13% Portfolio Mathematics 1) Convert the stock prices to returns 2) To the left are the returns for three stocks. Calculate the mean, variance, standard deviation for each return series in the appropriates spaces. 3) Find the covariance between stocks. 4) Find the mean, variance, and standard deviation for the return of three portfolios A,B, and C. 5) Given the risk free rate of 0.13%, figure out the Sharpe ratio and find the best portfolio.
Step by Step Solution
There are 3 Steps involved in it

Get step-by-step solutions from verified subject matter experts