Question: Able-Baker Problem in excel as a spreadsheet is required Example 2.6: The Able-Baker Call Center Problem A computer technical support center is staffed by two

Able-Baker Problem in excel as a spreadsheet is required Able-Baker Problem in excel as a spreadsheet is

Example 2.6: The Able-Baker Call Center Problem A computer technical support center is staffed by two people, Able and Baker, who take calls and try to answer questions and solve computer problems. The time between calls ranges from 1 to 4 minutes, with distribution as shown in Table 2.12. Able is more experienced and can provide service faster than Baker. The distributions of their service times are shown in Tables 2.13 and 2.14. When both are idle, Able takes the call. If both are busy, the call goes on hold; this is basically the same as a customer having to wait in line in any queueing model. In general, arrival times, service times, and hence clock times in a simulation should be continuous (real-valued) variables; the fact Table 2.12 Interarrival Distribution of Calls for Technical Support 41 Interarrival Distribution of Calls Interarrival Cumulative Time Probability Probability (Minutes) 0.25 0.25 0.40 0.65 10 0.20 0.85 11 0.15 1.00 Reference Table: 2.13 Table 2.13 Distribution of Able's Service Time F G H 4 Able's Service Time Distribution Service Times Probability Cumulative (Minutes) Probability 0.30 0.30 0.28 0.58 10 4 0.25 0.83 0.17 Table: 2.14 Table 2.14 Distribution of Baker's Service Time 5 Baker's Service Time Distribution Service Times Cumulative Probability Probability (Minutes) 0.35 0.35 0.25 0.60 0.20 0.80 0.20 1.00 Example 2.6: The Able-Baker Call Center Problem A computer technical support center is staffed by two people, Able and Baker, who take calls and try to answer questions and solve computer problems. The time between calls ranges from 1 to 4 minutes, with distribution as shown in Table 2.12. Able is more experienced and can provide service faster than Baker. The distributions of their service times are shown in Tables 2.13 and 2.14. When both are idle, Able takes the call. If both are busy, the call goes on hold; this is basically the same as a customer having to wait in line in any queueing model. In general, arrival times, service times, and hence clock times in a simulation should be continuous (real-valued) variables; the fact Table 2.12 Interarrival Distribution of Calls for Technical Support 41 Interarrival Distribution of Calls Interarrival Cumulative Time Probability Probability (Minutes) 0.25 0.25 0.40 0.65 10 0.20 0.85 11 0.15 1.00 Reference Table: 2.13 Table 2.13 Distribution of Able's Service Time F G H 4 Able's Service Time Distribution Service Times Probability Cumulative (Minutes) Probability 0.30 0.30 0.28 0.58 10 4 0.25 0.83 0.17 Table: 2.14 Table 2.14 Distribution of Baker's Service Time 5 Baker's Service Time Distribution Service Times Cumulative Probability Probability (Minutes) 0.35 0.35 0.25 0.60 0.20 0.80 0.20 1.00

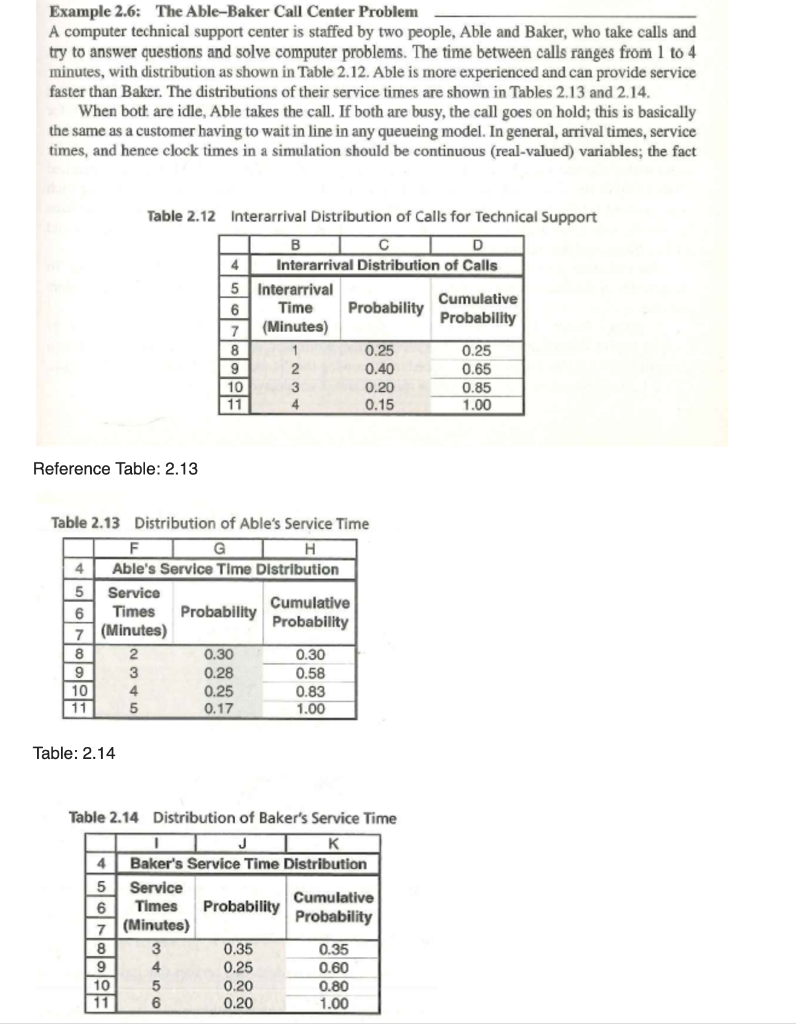
Step by Step Solution

There are 3 Steps involved in it

1 Expert Approved Answer
Step: 1 Unlock blur-text-image
Question Has Been Solved by an Expert!

Get step-by-step solutions from verified subject matter experts

Step: 2 Unlock
Step: 3 Unlock

Students Have Also Explored These Related General Management Questions!