

Above the given data in the figure of Southwest Airlines and American Airlines 2 years of data
Fantastic news! We've Found the answer you've been seeking!
Question:
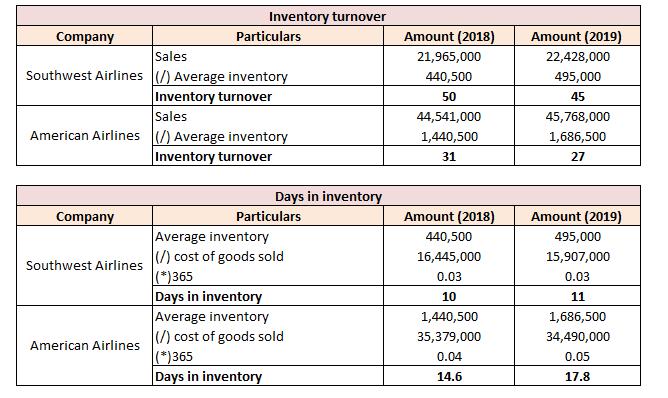
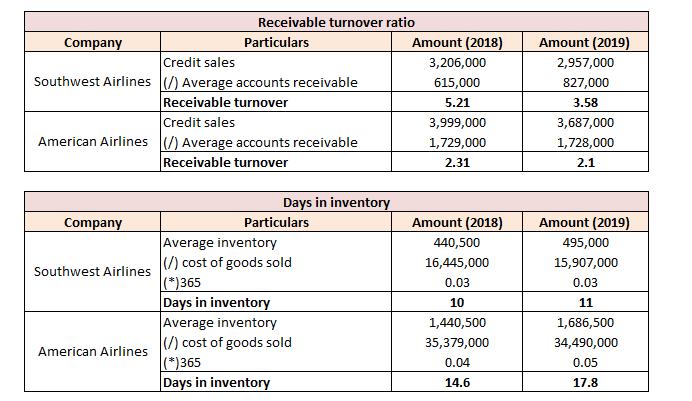
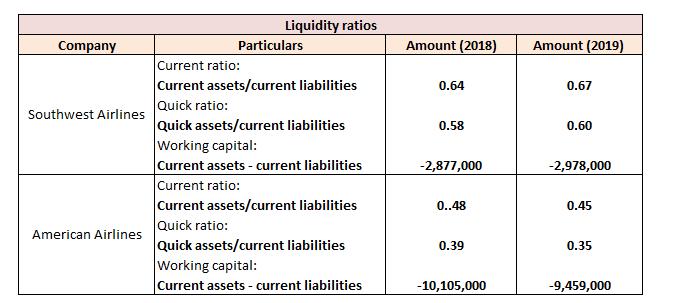
Above the given data in the figure of Southwest Airlines and American Airlines 2 years of data 2018 and 2019. Explain it and compare: What the given figure says.
1) Explain and compare both airlines data of 2018 and 2019 inventory turnover and the days in inventory.
2) Explain and compare both airlines data of 2018 and 2019 receivables turnover and the days in inventory.
3) Explain and compare both airlines data of 2018 and 2019 working capital, current ratio and quick ratio for two years (liquidity ratios).
Expert Answer:
1The higher the inventory turnover the better since high inventory turnover typically means a compan... View the full answer

Related Book For 

Basic Business Statistics Concepts And Applications
ISBN: 9780134684840
14th Edition
Authors: Mark L. Berenson, David M. Levine, Kathryn A. Szabat, David F. Stephan
Posted Date:
