

Question: 1. From the class data, make a line graph showing HR responses to the cold pressor test. Time is horizontal and HR is vertical;
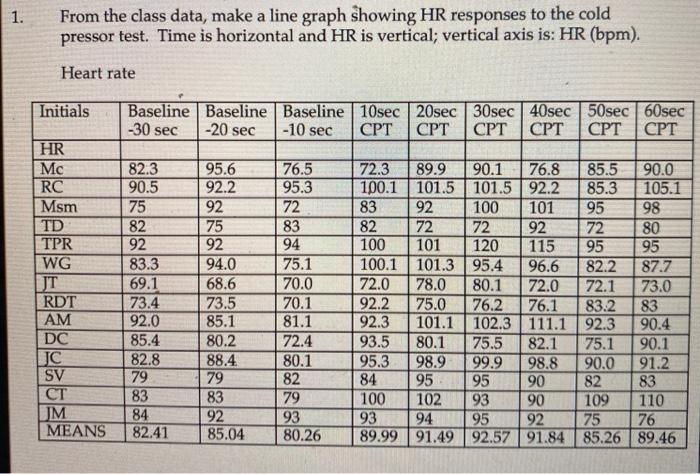

1. From the class data, make a line graph showing HR responses to the cold pressor test. Time is horizontal and HR is vertical; vertical axis is: HR (bpm). Heart rate Initials HR Mc RC Msm TD TPR WG JT RDT AM DC Baseline -30 sec JC SV CT JM 82.3 90.5 83.3 69.1 73.4 92.0 85.4 82.8 79 83 84 MEANS 82.41 75 82 92 Baseline Baseline 10sec 20sec 30sec 40sec 50sec 60sec -20 sec -10 sec CPT CPT CPT CPT CPT CPT 95.6 92.2 92 75 92 94.0 68.6 73.5 85.1 80.2 88.4 79 83 92 85.04 76.5 95.3 72 83 94 75.1 70.0 70.1 81.1 72.4 80.1 82 79 93 80.26 72.3 89.9 100.1 90.1 76.8 85.5 85.3 101.5 101.5 92.2 100 101 72 120 100.1 101.3 95.4 83 92 82 72 100 101 92 115 95 72 95 96.6 82.2 72.1 76.1 83.2 111.1 92.3 72.0 78.0 80.1 72.0 75.0 76.2 101.1 102.3 92.2 92.3 93.5 80.1 75.5 82.1 75.1 95.3 98.9 99.9 98.8 90.0 84 95 95 90 82 100 102 93 90 109 93 94 95 92 75 89.99 91.49 92.57 91.84 85.26 90.0 105.1 98 80 95 87.7 73.0 83 90.4 90.1 91.2 83 110 76 89.46 3/ Describe the results for each graph..
Step by Step Solution
3.46 Rating (153 Votes )
There are 3 Steps involved in it
To create the line graph representing the HR responses to the cold pressor test we will use the give... View full answer

Get step-by-step solutions from verified subject matter experts