

Question: 1) Based on the data below and Figure (1) that shows a partially completed pay structure for control operator positions. Your first task is
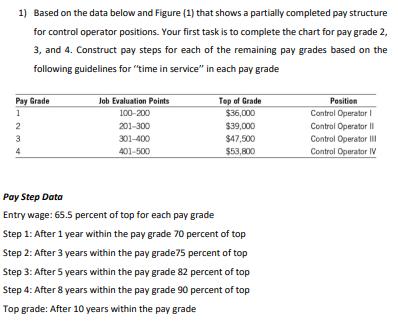
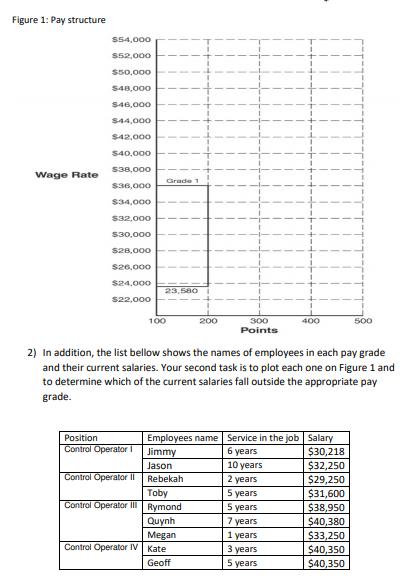
1) Based on the data below and Figure (1) that shows a partially completed pay structure for control operator positions. Your first task is to complete the chart for pay grade 2, 3, and 4. Construct pay steps for each of the remaining pay grades based on the following guidelines for "time in service" in each pay grade Job Evaluation Points Top of Grade $36,000 Pay Grade Position Control Operator I Control Operator I 100-200 201-300 $39,000 3 301-400 $47,500 Control Operator Il 4 401-500 $53,800 Control Operator IV Pay Step Data Entry wage: 65.5 percent of top for each pay grade Step 1: After 1 year within the pay grade 70 percent of top Step 2: After 3 years within the pay grade75 percent of top Step 3: After 5 years within the pay grade 82 percent of top Step 4: After 8 years within the pay grade 90 percent of top Top grade: After 10 years within the pay grade 23 Figure 1: Pay structure S54,000 $52,000 $50,000 S48,000 $46,000 S44,000 $42,000 S40,000 S38,000 Wage Rate Grade $36,000 $34,000 $32,000 S30,000 S28,000 s26,000 s24,000 23,580 s22,000 100 200 300 Points 400 500 2) In addition, the list bellow shows the names of employees in each pay grade and their current salaries. Your second task is to plot each one on Figure 1 and to determine which of the current salaries fall outside the appropriate pay grade. Position Employees name Service in the job Salary 6 years 10 years Control Operator I Jimmy $30,218 Jason $32,250 Control Operator I Rebekah $29,250 2 years 5 years 5 years 7 years 1 years Toby Control Operator III| Rymond $31,600 Quynh Megan Control Operator IV Kate $38,950 $40,380 $33,250 $40,350 $40,350 3 years 5 years Geoff 1) Based on the data below and Figure (1) that shows a partially completed pay structure for control operator positions. Your first task is to complete the chart for pay grade 2, 3, and 4. Construct pay steps for each of the remaining pay grades based on the following guidelines for "time in service" in each pay grade Job Evaluation Points Top of Grade $36,000 Pay Grade Position Control Operator I Control Operator I 100-200 201-300 $39,000 3 301-400 $47,500 Control Operator Il 4 401-500 $53,800 Control Operator IV Pay Step Data Entry wage: 65.5 percent of top for each pay grade Step 1: After 1 year within the pay grade 70 percent of top Step 2: After 3 years within the pay grade75 percent of top Step 3: After 5 years within the pay grade 82 percent of top Step 4: After 8 years within the pay grade 90 percent of top Top grade: After 10 years within the pay grade 23 Figure 1: Pay structure S54,000 $52,000 $50,000 S48,000 $46,000 S44,000 $42,000 S40,000 S38,000 Wage Rate Grade $36,000 $34,000 $32,000 S30,000 S28,000 s26,000 s24,000 23,580 s22,000 100 200 300 Points 400 500 2) In addition, the list bellow shows the names of employees in each pay grade and their current salaries. Your second task is to plot each one on Figure 1 and to determine which of the current salaries fall outside the appropriate pay grade. Position Employees name Service in the job Salary 6 years 10 years Control Operator I Jimmy $30,218 Jason $32,250 Control Operator I Rebekah $29,250 2 years 5 years 5 years 7 years 1 years Toby Control Operator III| Rymond $31,600 Quynh Megan Control Operator IV Kate $38,950 $40,380 $33,250 $40,350 $40,350 3 years 5 years Geoff 1) Based on the data below and Figure (1) that shows a partially completed pay structure for control operator positions. Your first task is to complete the chart for pay grade 2, 3, and 4. Construct pay steps for each of the remaining pay grades based on the following guidelines for "time in service" in each pay grade Job Evaluation Points Top of Grade $36,000 Pay Grade Position Control Operator I Control Operator I 100-200 201-300 $39,000 3 301-400 $47,500 Control Operator Il 4 401-500 $53,800 Control Operator IV Pay Step Data Entry wage: 65.5 percent of top for each pay grade Step 1: After 1 year within the pay grade 70 percent of top Step 2: After 3 years within the pay grade75 percent of top Step 3: After 5 years within the pay grade 82 percent of top Step 4: After 8 years within the pay grade 90 percent of top Top grade: After 10 years within the pay grade 23 Figure 1: Pay structure S54,000 $52,000 $50,000 S48,000 $46,000 S44,000 $42,000 S40,000 S38,000 Wage Rate Grade $36,000 $34,000 $32,000 S30,000 S28,000 s26,000 s24,000 23,580 s22,000 100 200 300 Points 400 500 2) In addition, the list bellow shows the names of employees in each pay grade and their current salaries. Your second task is to plot each one on Figure 1 and to determine which of the current salaries fall outside the appropriate pay grade. Position Employees name Service in the job Salary 6 years 10 years Control Operator I Jimmy $30,218 Jason $32,250 Control Operator I Rebekah $29,250 2 years 5 years 5 years 7 years 1 years Toby Control Operator III| Rymond $31,600 Quynh Megan Control Operator IV Kate $38,950 $40,380 $33,250 $40,350 $40,350 3 years 5 years Geoff
Step by Step Solution
There are 3 Steps involved in it
1st solution Weve plotted the grade level wage graph base... View full answer

Get step-by-step solutions from verified subject matter experts