

Question: 1. What is the difference between a rate of change and an average rate of change? 2. Give the formula for calculating average rate
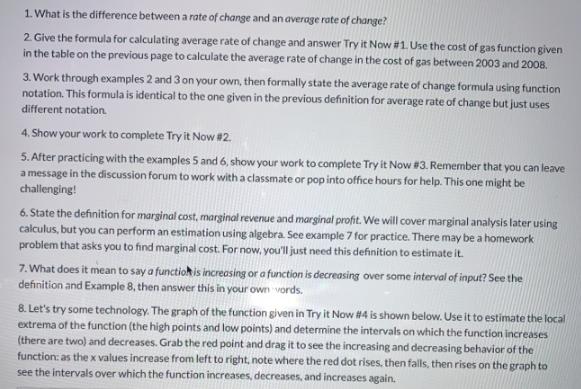
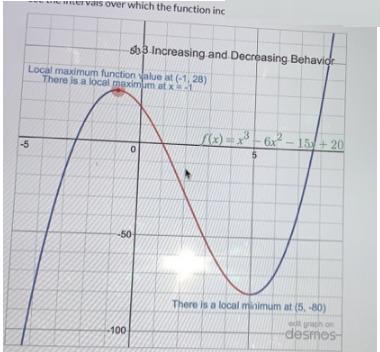
1. What is the difference between a rate of change and an average rate of change? 2. Give the formula for calculating average rate of change and answer Try it Now #1. Use the cost of gas function given in the table on the previous page to calculate the average rate of change in the cost of gas between 2003 and 2008. 3. Work through examples 2 and 3 on your own, then formally state the average rate of change formula using function notation. This formula is identical to the one given in the previous definition for average rate of change but just uses different notation. 4. Show your work to complete Try it Now #2. 5. After practicing with the examples 5 and 6, show your work to complete Try it Now #3. Remember that you can leave a message in the discussion forum to work with a classmate or pop into office hours for help. This one might be challenging! 6. State the definition for marginal cost, marginal revenue and marginal profit. We will cover marginal analysis later using calculus, but you can perform an estimation using algebra. See example 7 for practice. There may be a homework problem that asks you to find marginal cost. For now, you'll just need this definition to estimate it. 7. What does it mean to say a function is increasing or a function is decreasing over some interval of input? See the definition and Example 8, then answer this in your own words. 8. Let's try some technology. The graph of the function given in Try it Now #4 is shown below. Use it to estimate the local extrema of the function (the high points and low points) and determine the intervals on which the function increases (there are two) and decreases. Grab the red point and drag it to see the increasing and decreasing behavior of the function: as the x values increase from left to right, note where the red dot rises, then falls, then rises on the graph to see the intervals over which the function increases, decreases, and increases again. ervals over which the function inc -5 Local maximum function value at (-1,28) There is a local maximum at x-1 sb3 Increasing and Decreasing Behavior -100 0 -50 f(x) 5 6x-15+20 There is a local minimum at (5, -80) grach desmos-
Step by Step Solution
3.50 Rating (173 Votes )
There are 3 Steps involved in it
1A rate of change refers to the amount of change in a variable with respect to another variable over a given period of time or interval while average rate of change refers to the average amount of cha... View full answer

Get step-by-step solutions from verified subject matter experts