

1. Create the String Data sheet and work through the different ways of visualizing proportions and...
Fantastic news! We've Found the answer you've been seeking!
Question:

Transcribed Image Text:
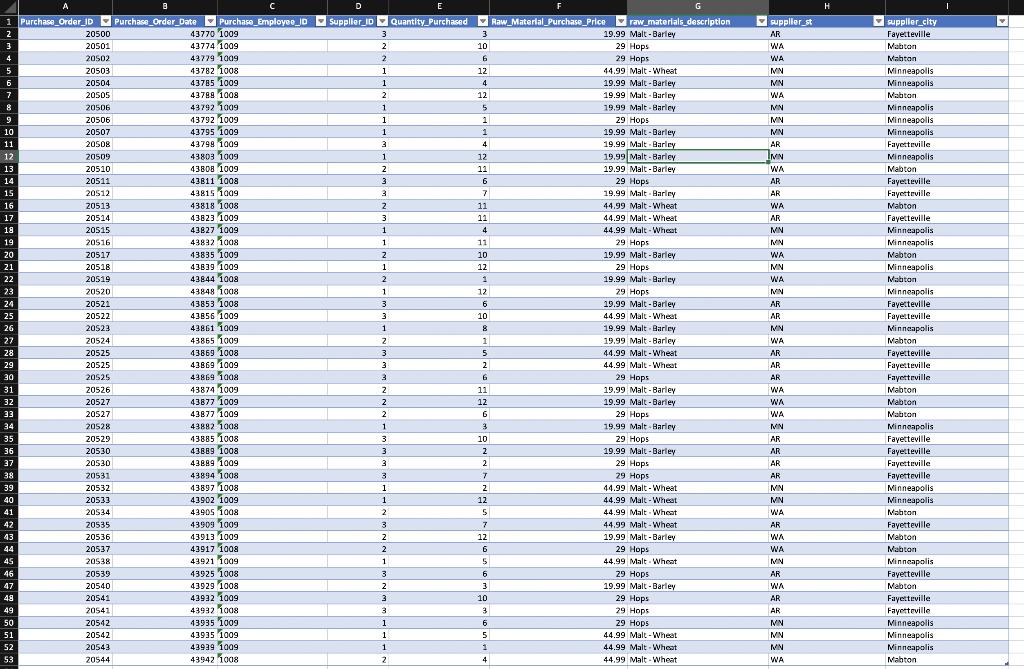
1. Create the String Data sheet and work through the different ways of visualizing proportions and counts. 2. Create the Geographic Data sheet and work through symbol and filled maps for quantity purchased. Ask the Question: How do data types affect the way I can analyze data in Tableau? Master the Data: This lab is a continuation of Lab 3-2. Make sure to work through the Master the Data steps in Lab 3-2 before proceeding to this lab to ensure that you have imported the data from Lab 3-2 and changed all the data types appropriately according to Steps 1 and 2. Software needed • Tableau Screen capture tool (Windows: Snipping Tool; Mac: Cmd+Shift+4) Data: 3-3 Alt Data.twbx or you may use your solution file for Lab 3-2 Alt Data,xlsx Perform the Analysis: Refer to Lab 3-3 Alternate in the text for instructions and Lab 3-3 steps for each of the lab parts. Share the Story: You have now visualized a variety of different data types, compared different charts for analyzing and exploring categorical data, and created maps to analyze and explore geographic data. Part 1: Upload Your Files Part 2: Assessment D E 1 Purchase Order JD Purchase_Order_Date Purchase_Employee_D Supplier ID Quantity_Purchased - Raw_Materlal_Purchase_Price raw_materials description 19.99 Malt -Barley supplier st supplier city Fayetteville 43770 1009 43774 1009 43779 1009 2 20500 3 AR 3 20501 2 10 29 Ноps 29 Hops WA Mabton 4 20502 2. WA Mahton 43782 1008 43785 1009 43788 1008 43792 1009 43792 1009 43795 1009 43798 1009 43803 1009 43808 1009 43811 1008 43815 1a09 20503 44.99 Malt- Wheat Minneapolis 1 1 12 MN 6 20504 4 19.99 Malt - Barley MN Minneapolis 7. 20505 2 12 19.99 Malt - Barley WA Mabton 20506 5 19.99 Malt - Barley Minneapolis MN 9 20506 1 29 Hops MN Minneapolis 10 20507 1 1 19.99 Malt -Barley MN Minneapolis 19.99 Malt - Barley Fayetteville Minneapolis Mabton Fayetteville Fayetteville 11 20508 3 4 AR 12 20509 1 12 19.99 Malt - Barley IMN 13 20510 11 19.99 Malt- Barley WA 3. 6 29 Норs 19.99 Malt - Barley 14 20511 AR 15 20512 3 7 AR 43818 1008 43823 1009 43827 1009 43832 1008 43835 1009 43839 1009 43844 1008 43848 1008 43853 1008 43856 1009 43861 1009 43865 1009 43869 1008 43869 1009 16 20513 11 44.99 Malt -Wheat WA Mabton 17 20514 3 11 44.99 Malt - Wheat AR Fayetteville 18 20515 1 4 44.99 Malt - Wheat MN Minneapolis Minneapolis 19 20516 1 11 29 Hops MN 20 20517 10 19.99 Malt - Barley WA Mabton 21 20518 12 29 Ноps MN Minneapolis 1 19.99 Malt - Barley 29 Hops 19.99 Malt - Barley 44.99 Malt - Wheat 19.99 Malt- Barley 22 20519 WA Mabton Minneapolis Fayetteville Fayetteville Minneapolis 23 20520 1 12 MN 24 20521 AR 25 20522 3 10 AR 26 20523 1 MN 27 20524 1 19.99 Malt - Barley WA Mabton 28 20525 3. 5 44.99 Malt - Wheat AR Fayetteville 29 20525 3 2 44.99 Malt -Wheat AR Fayetteville Fayetteville 43869 1008 43874 1009 30 20525 29 Hops AR 31 20526 2 11 19.99 Malt - Barley WA Mabton 43877 1009 43877 1009 32 20527 2 12 19.99 Malt - Barley WA Mabton 33 20527 2 29 Hops 19.99 Malt- Rarley WA Mabton 43882 1008 43885 1008 43889 1008 43889 1009 43894 1008 43897 1008 43902 1009 43905 1008 Minneapolis Fayetteville Fayetteville 34 20528 1 3 MN 35 20529 3. 10 29 Hops AR 36 20530 3 19.99 Malt - Barley AR 37 20530 2 29 Hops AR Fayetteville Fayetteville 38 20531 3. 29 Ноps AR 39 20532 1 2 44.99 Malt-Wheat MN Minneapolis Minneapolis 40 20533 1 12 44.99 Malt - Wheat MN 41 20534 5 44.99 Malt - Wheat WA Mabton 43909 1009 43913 1009 43917 1008 43921 1009 44.99 Malt -Wheat 19.99 Malt - Barley 42 20535 AR Fayetteville 43 20536 12 WA Mabton 44 20537 29 Hops 44.99 Malt . Wheat WA Mabton 45 20538 1 Minneapolis Fayetteville Mabton Fayetteville MN 43925 1008 43929 1008 43932 1009 43932 1008 43935 1009 43935 1009 43939 1009 43942 1008 46 20539 6 29 Hops AR 19.99 Malt - Barley 29 Hops 47 20540 3 WA 48 20541 3. 10 AR 49 20541 3. 3 29 Hops AR Fayetteville 50 20542 1 6 29 Hops MN Minneapolis 51 20542 1 44.99 Malt - Wheat MN Minneapolis 52 20543 1. 44.99 Malt .Wheat MN Minneapolis 53 20544 4. 44.99 Malt - Wheat WA Mahton Required: 1. From which state were the most products purchased? O Arkansas O Minnesota O Washington 2. How many products were purchased from Arkansas? O 134 O 135 O 979 O 107 3. Which product had the largest proportion of purchase orders? O Malt-Wheat O Malt-Barley О Ноps 4. How many purchase orders were generated grand total (count, across all states and products)? O 152 O 98 O 52 О 344 1. Create the String Data sheet and work through the different ways of visualizing proportions and counts. 2. Create the Geographic Data sheet and work through symbol and filled maps for quantity purchased. Ask the Question: How do data types affect the way I can analyze data in Tableau? Master the Data: This lab is a continuation of Lab 3-2. Make sure to work through the Master the Data steps in Lab 3-2 before proceeding to this lab to ensure that you have imported the data from Lab 3-2 and changed all the data types appropriately according to Steps 1 and 2. Software needed • Tableau Screen capture tool (Windows: Snipping Tool; Mac: Cmd+Shift+4) Data: 3-3 Alt Data.twbx or you may use your solution file for Lab 3-2 Alt Data,xlsx Perform the Analysis: Refer to Lab 3-3 Alternate in the text for instructions and Lab 3-3 steps for each of the lab parts. Share the Story: You have now visualized a variety of different data types, compared different charts for analyzing and exploring categorical data, and created maps to analyze and explore geographic data. Part 1: Upload Your Files Part 2: Assessment D E 1 Purchase Order JD Purchase_Order_Date Purchase_Employee_D Supplier ID Quantity_Purchased - Raw_Materlal_Purchase_Price raw_materials description 19.99 Malt -Barley supplier st supplier city Fayetteville 43770 1009 43774 1009 43779 1009 2 20500 3 AR 3 20501 2 10 29 Ноps 29 Hops WA Mabton 4 20502 2. WA Mahton 43782 1008 43785 1009 43788 1008 43792 1009 43792 1009 43795 1009 43798 1009 43803 1009 43808 1009 43811 1008 43815 1a09 20503 44.99 Malt- Wheat Minneapolis 1 1 12 MN 6 20504 4 19.99 Malt - Barley MN Minneapolis 7. 20505 2 12 19.99 Malt - Barley WA Mabton 20506 5 19.99 Malt - Barley Minneapolis MN 9 20506 1 29 Hops MN Minneapolis 10 20507 1 1 19.99 Malt -Barley MN Minneapolis 19.99 Malt - Barley Fayetteville Minneapolis Mabton Fayetteville Fayetteville 11 20508 3 4 AR 12 20509 1 12 19.99 Malt - Barley IMN 13 20510 11 19.99 Malt- Barley WA 3. 6 29 Норs 19.99 Malt - Barley 14 20511 AR 15 20512 3 7 AR 43818 1008 43823 1009 43827 1009 43832 1008 43835 1009 43839 1009 43844 1008 43848 1008 43853 1008 43856 1009 43861 1009 43865 1009 43869 1008 43869 1009 16 20513 11 44.99 Malt -Wheat WA Mabton 17 20514 3 11 44.99 Malt - Wheat AR Fayetteville 18 20515 1 4 44.99 Malt - Wheat MN Minneapolis Minneapolis 19 20516 1 11 29 Hops MN 20 20517 10 19.99 Malt - Barley WA Mabton 21 20518 12 29 Ноps MN Minneapolis 1 19.99 Malt - Barley 29 Hops 19.99 Malt - Barley 44.99 Malt - Wheat 19.99 Malt- Barley 22 20519 WA Mabton Minneapolis Fayetteville Fayetteville Minneapolis 23 20520 1 12 MN 24 20521 AR 25 20522 3 10 AR 26 20523 1 MN 27 20524 1 19.99 Malt - Barley WA Mabton 28 20525 3. 5 44.99 Malt - Wheat AR Fayetteville 29 20525 3 2 44.99 Malt -Wheat AR Fayetteville Fayetteville 43869 1008 43874 1009 30 20525 29 Hops AR 31 20526 2 11 19.99 Malt - Barley WA Mabton 43877 1009 43877 1009 32 20527 2 12 19.99 Malt - Barley WA Mabton 33 20527 2 29 Hops 19.99 Malt- Rarley WA Mabton 43882 1008 43885 1008 43889 1008 43889 1009 43894 1008 43897 1008 43902 1009 43905 1008 Minneapolis Fayetteville Fayetteville 34 20528 1 3 MN 35 20529 3. 10 29 Hops AR 36 20530 3 19.99 Malt - Barley AR 37 20530 2 29 Hops AR Fayetteville Fayetteville 38 20531 3. 29 Ноps AR 39 20532 1 2 44.99 Malt-Wheat MN Minneapolis Minneapolis 40 20533 1 12 44.99 Malt - Wheat MN 41 20534 5 44.99 Malt - Wheat WA Mabton 43909 1009 43913 1009 43917 1008 43921 1009 44.99 Malt -Wheat 19.99 Malt - Barley 42 20535 AR Fayetteville 43 20536 12 WA Mabton 44 20537 29 Hops 44.99 Malt . Wheat WA Mabton 45 20538 1 Minneapolis Fayetteville Mabton Fayetteville MN 43925 1008 43929 1008 43932 1009 43932 1008 43935 1009 43935 1009 43939 1009 43942 1008 46 20539 6 29 Hops AR 19.99 Malt - Barley 29 Hops 47 20540 3 WA 48 20541 3. 10 AR 49 20541 3. 3 29 Hops AR Fayetteville 50 20542 1 6 29 Hops MN Minneapolis 51 20542 1 44.99 Malt - Wheat MN Minneapolis 52 20543 1. 44.99 Malt .Wheat MN Minneapolis 53 20544 4. 44.99 Malt - Wheat WA Mahton Required: 1. From which state were the most products purchased? O Arkansas O Minnesota O Washington 2. How many products were purchased from Arkansas? O 134 O 135 O 979 O 107 3. Which product had the largest proportion of purchase orders? O Malt-Wheat O Malt-Barley О Ноps 4. How many purchase orders were generated grand total (count, across all states and products)? O 152 O 98 O 52 О 344 1. Create the String Data sheet and work through the different ways of visualizing proportions and counts. 2. Create the Geographic Data sheet and work through symbol and filled maps for quantity purchased. Ask the Question: How do data types affect the way I can analyze data in Tableau? Master the Data: This lab is a continuation of Lab 3-2. Make sure to work through the Master the Data steps in Lab 3-2 before proceeding to this lab to ensure that you have imported the data from Lab 3-2 and changed all the data types appropriately according to Steps 1 and 2. Software needed • Tableau Screen capture tool (Windows: Snipping Tool; Mac: Cmd+Shift+4) Data: 3-3 Alt Data.twbx or you may use your solution file for Lab 3-2 Alt Data,xlsx Perform the Analysis: Refer to Lab 3-3 Alternate in the text for instructions and Lab 3-3 steps for each of the lab parts. Share the Story: You have now visualized a variety of different data types, compared different charts for analyzing and exploring categorical data, and created maps to analyze and explore geographic data. Part 1: Upload Your Files Part 2: Assessment D E 1 Purchase Order JD Purchase_Order_Date Purchase_Employee_D Supplier ID Quantity_Purchased - Raw_Materlal_Purchase_Price raw_materials description 19.99 Malt -Barley supplier st supplier city Fayetteville 43770 1009 43774 1009 43779 1009 2 20500 3 AR 3 20501 2 10 29 Ноps 29 Hops WA Mabton 4 20502 2. WA Mahton 43782 1008 43785 1009 43788 1008 43792 1009 43792 1009 43795 1009 43798 1009 43803 1009 43808 1009 43811 1008 43815 1a09 20503 44.99 Malt- Wheat Minneapolis 1 1 12 MN 6 20504 4 19.99 Malt - Barley MN Minneapolis 7. 20505 2 12 19.99 Malt - Barley WA Mabton 20506 5 19.99 Malt - Barley Minneapolis MN 9 20506 1 29 Hops MN Minneapolis 10 20507 1 1 19.99 Malt -Barley MN Minneapolis 19.99 Malt - Barley Fayetteville Minneapolis Mabton Fayetteville Fayetteville 11 20508 3 4 AR 12 20509 1 12 19.99 Malt - Barley IMN 13 20510 11 19.99 Malt- Barley WA 3. 6 29 Норs 19.99 Malt - Barley 14 20511 AR 15 20512 3 7 AR 43818 1008 43823 1009 43827 1009 43832 1008 43835 1009 43839 1009 43844 1008 43848 1008 43853 1008 43856 1009 43861 1009 43865 1009 43869 1008 43869 1009 16 20513 11 44.99 Malt -Wheat WA Mabton 17 20514 3 11 44.99 Malt - Wheat AR Fayetteville 18 20515 1 4 44.99 Malt - Wheat MN Minneapolis Minneapolis 19 20516 1 11 29 Hops MN 20 20517 10 19.99 Malt - Barley WA Mabton 21 20518 12 29 Ноps MN Minneapolis 1 19.99 Malt - Barley 29 Hops 19.99 Malt - Barley 44.99 Malt - Wheat 19.99 Malt- Barley 22 20519 WA Mabton Minneapolis Fayetteville Fayetteville Minneapolis 23 20520 1 12 MN 24 20521 AR 25 20522 3 10 AR 26 20523 1 MN 27 20524 1 19.99 Malt - Barley WA Mabton 28 20525 3. 5 44.99 Malt - Wheat AR Fayetteville 29 20525 3 2 44.99 Malt -Wheat AR Fayetteville Fayetteville 43869 1008 43874 1009 30 20525 29 Hops AR 31 20526 2 11 19.99 Malt - Barley WA Mabton 43877 1009 43877 1009 32 20527 2 12 19.99 Malt - Barley WA Mabton 33 20527 2 29 Hops 19.99 Malt- Rarley WA Mabton 43882 1008 43885 1008 43889 1008 43889 1009 43894 1008 43897 1008 43902 1009 43905 1008 Minneapolis Fayetteville Fayetteville 34 20528 1 3 MN 35 20529 3. 10 29 Hops AR 36 20530 3 19.99 Malt - Barley AR 37 20530 2 29 Hops AR Fayetteville Fayetteville 38 20531 3. 29 Ноps AR 39 20532 1 2 44.99 Malt-Wheat MN Minneapolis Minneapolis 40 20533 1 12 44.99 Malt - Wheat MN 41 20534 5 44.99 Malt - Wheat WA Mabton 43909 1009 43913 1009 43917 1008 43921 1009 44.99 Malt -Wheat 19.99 Malt - Barley 42 20535 AR Fayetteville 43 20536 12 WA Mabton 44 20537 29 Hops 44.99 Malt . Wheat WA Mabton 45 20538 1 Minneapolis Fayetteville Mabton Fayetteville MN 43925 1008 43929 1008 43932 1009 43932 1008 43935 1009 43935 1009 43939 1009 43942 1008 46 20539 6 29 Hops AR 19.99 Malt - Barley 29 Hops 47 20540 3 WA 48 20541 3. 10 AR 49 20541 3. 3 29 Hops AR Fayetteville 50 20542 1 6 29 Hops MN Minneapolis 51 20542 1 44.99 Malt - Wheat MN Minneapolis 52 20543 1. 44.99 Malt .Wheat MN Minneapolis 53 20544 4. 44.99 Malt - Wheat WA Mahton Required: 1. From which state were the most products purchased? O Arkansas O Minnesota O Washington 2. How many products were purchased from Arkansas? O 134 O 135 O 979 O 107 3. Which product had the largest proportion of purchase orders? O Malt-Wheat O Malt-Barley О Ноps 4. How many purchase orders were generated grand total (count, across all states and products)? O 152 O 98 O 52 О 344 1. Create the String Data sheet and work through the different ways of visualizing proportions and counts. 2. Create the Geographic Data sheet and work through symbol and filled maps for quantity purchased. Ask the Question: How do data types affect the way I can analyze data in Tableau? Master the Data: This lab is a continuation of Lab 3-2. Make sure to work through the Master the Data steps in Lab 3-2 before proceeding to this lab to ensure that you have imported the data from Lab 3-2 and changed all the data types appropriately according to Steps 1 and 2. Software needed • Tableau Screen capture tool (Windows: Snipping Tool; Mac: Cmd+Shift+4) Data: 3-3 Alt Data.twbx or you may use your solution file for Lab 3-2 Alt Data,xlsx Perform the Analysis: Refer to Lab 3-3 Alternate in the text for instructions and Lab 3-3 steps for each of the lab parts. Share the Story: You have now visualized a variety of different data types, compared different charts for analyzing and exploring categorical data, and created maps to analyze and explore geographic data. Part 1: Upload Your Files Part 2: Assessment D E 1 Purchase Order JD Purchase_Order_Date Purchase_Employee_D Supplier ID Quantity_Purchased - Raw_Materlal_Purchase_Price raw_materials description 19.99 Malt -Barley supplier st supplier city Fayetteville 43770 1009 43774 1009 43779 1009 2 20500 3 AR 3 20501 2 10 29 Ноps 29 Hops WA Mabton 4 20502 2. WA Mahton 43782 1008 43785 1009 43788 1008 43792 1009 43792 1009 43795 1009 43798 1009 43803 1009 43808 1009 43811 1008 43815 1a09 20503 44.99 Malt- Wheat Minneapolis 1 1 12 MN 6 20504 4 19.99 Malt - Barley MN Minneapolis 7. 20505 2 12 19.99 Malt - Barley WA Mabton 20506 5 19.99 Malt - Barley Minneapolis MN 9 20506 1 29 Hops MN Minneapolis 10 20507 1 1 19.99 Malt -Barley MN Minneapolis 19.99 Malt - Barley Fayetteville Minneapolis Mabton Fayetteville Fayetteville 11 20508 3 4 AR 12 20509 1 12 19.99 Malt - Barley IMN 13 20510 11 19.99 Malt- Barley WA 3. 6 29 Норs 19.99 Malt - Barley 14 20511 AR 15 20512 3 7 AR 43818 1008 43823 1009 43827 1009 43832 1008 43835 1009 43839 1009 43844 1008 43848 1008 43853 1008 43856 1009 43861 1009 43865 1009 43869 1008 43869 1009 16 20513 11 44.99 Malt -Wheat WA Mabton 17 20514 3 11 44.99 Malt - Wheat AR Fayetteville 18 20515 1 4 44.99 Malt - Wheat MN Minneapolis Minneapolis 19 20516 1 11 29 Hops MN 20 20517 10 19.99 Malt - Barley WA Mabton 21 20518 12 29 Ноps MN Minneapolis 1 19.99 Malt - Barley 29 Hops 19.99 Malt - Barley 44.99 Malt - Wheat 19.99 Malt- Barley 22 20519 WA Mabton Minneapolis Fayetteville Fayetteville Minneapolis 23 20520 1 12 MN 24 20521 AR 25 20522 3 10 AR 26 20523 1 MN 27 20524 1 19.99 Malt - Barley WA Mabton 28 20525 3. 5 44.99 Malt - Wheat AR Fayetteville 29 20525 3 2 44.99 Malt -Wheat AR Fayetteville Fayetteville 43869 1008 43874 1009 30 20525 29 Hops AR 31 20526 2 11 19.99 Malt - Barley WA Mabton 43877 1009 43877 1009 32 20527 2 12 19.99 Malt - Barley WA Mabton 33 20527 2 29 Hops 19.99 Malt- Rarley WA Mabton 43882 1008 43885 1008 43889 1008 43889 1009 43894 1008 43897 1008 43902 1009 43905 1008 Minneapolis Fayetteville Fayetteville 34 20528 1 3 MN 35 20529 3. 10 29 Hops AR 36 20530 3 19.99 Malt - Barley AR 37 20530 2 29 Hops AR Fayetteville Fayetteville 38 20531 3. 29 Ноps AR 39 20532 1 2 44.99 Malt-Wheat MN Minneapolis Minneapolis 40 20533 1 12 44.99 Malt - Wheat MN 41 20534 5 44.99 Malt - Wheat WA Mabton 43909 1009 43913 1009 43917 1008 43921 1009 44.99 Malt -Wheat 19.99 Malt - Barley 42 20535 AR Fayetteville 43 20536 12 WA Mabton 44 20537 29 Hops 44.99 Malt . Wheat WA Mabton 45 20538 1 Minneapolis Fayetteville Mabton Fayetteville MN 43925 1008 43929 1008 43932 1009 43932 1008 43935 1009 43935 1009 43939 1009 43942 1008 46 20539 6 29 Hops AR 19.99 Malt - Barley 29 Hops 47 20540 3 WA 48 20541 3. 10 AR 49 20541 3. 3 29 Hops AR Fayetteville 50 20542 1 6 29 Hops MN Minneapolis 51 20542 1 44.99 Malt - Wheat MN Minneapolis 52 20543 1. 44.99 Malt .Wheat MN Minneapolis 53 20544 4. 44.99 Malt - Wheat WA Mahton Required: 1. From which state were the most products purchased? O Arkansas O Minnesota O Washington 2. How many products were purchased from Arkansas? O 134 O 135 O 979 O 107 3. Which product had the largest proportion of purchase orders? O Malt-Wheat O Malt-Barley О Ноps 4. How many purchase orders were generated grand total (count, across all states and products)? O 152 O 98 O 52 О 344 1. Create the String Data sheet and work through the different ways of visualizing proportions and counts. 2. Create the Geographic Data sheet and work through symbol and filled maps for quantity purchased. Ask the Question: How do data types affect the way I can analyze data in Tableau? Master the Data: This lab is a continuation of Lab 3-2. Make sure to work through the Master the Data steps in Lab 3-2 before proceeding to this lab to ensure that you have imported the data from Lab 3-2 and changed all the data types appropriately according to Steps 1 and 2. Software needed • Tableau Screen capture tool (Windows: Snipping Tool; Mac: Cmd+Shift+4) Data: 3-3 Alt Data.twbx or you may use your solution file for Lab 3-2 Alt Data,xlsx Perform the Analysis: Refer to Lab 3-3 Alternate in the text for instructions and Lab 3-3 steps for each of the lab parts. Share the Story: You have now visualized a variety of different data types, compared different charts for analyzing and exploring categorical data, and created maps to analyze and explore geographic data. Part 1: Upload Your Files Part 2: Assessment D E 1 Purchase Order JD Purchase_Order_Date Purchase_Employee_D Supplier ID Quantity_Purchased - Raw_Materlal_Purchase_Price raw_materials description 19.99 Malt -Barley supplier st supplier city Fayetteville 43770 1009 43774 1009 43779 1009 2 20500 3 AR 3 20501 2 10 29 Ноps 29 Hops WA Mabton 4 20502 2. WA Mahton 43782 1008 43785 1009 43788 1008 43792 1009 43792 1009 43795 1009 43798 1009 43803 1009 43808 1009 43811 1008 43815 1a09 20503 44.99 Malt- Wheat Minneapolis 1 1 12 MN 6 20504 4 19.99 Malt - Barley MN Minneapolis 7. 20505 2 12 19.99 Malt - Barley WA Mabton 20506 5 19.99 Malt - Barley Minneapolis MN 9 20506 1 29 Hops MN Minneapolis 10 20507 1 1 19.99 Malt -Barley MN Minneapolis 19.99 Malt - Barley Fayetteville Minneapolis Mabton Fayetteville Fayetteville 11 20508 3 4 AR 12 20509 1 12 19.99 Malt - Barley IMN 13 20510 11 19.99 Malt- Barley WA 3. 6 29 Норs 19.99 Malt - Barley 14 20511 AR 15 20512 3 7 AR 43818 1008 43823 1009 43827 1009 43832 1008 43835 1009 43839 1009 43844 1008 43848 1008 43853 1008 43856 1009 43861 1009 43865 1009 43869 1008 43869 1009 16 20513 11 44.99 Malt -Wheat WA Mabton 17 20514 3 11 44.99 Malt - Wheat AR Fayetteville 18 20515 1 4 44.99 Malt - Wheat MN Minneapolis Minneapolis 19 20516 1 11 29 Hops MN 20 20517 10 19.99 Malt - Barley WA Mabton 21 20518 12 29 Ноps MN Minneapolis 1 19.99 Malt - Barley 29 Hops 19.99 Malt - Barley 44.99 Malt - Wheat 19.99 Malt- Barley 22 20519 WA Mabton Minneapolis Fayetteville Fayetteville Minneapolis 23 20520 1 12 MN 24 20521 AR 25 20522 3 10 AR 26 20523 1 MN 27 20524 1 19.99 Malt - Barley WA Mabton 28 20525 3. 5 44.99 Malt - Wheat AR Fayetteville 29 20525 3 2 44.99 Malt -Wheat AR Fayetteville Fayetteville 43869 1008 43874 1009 30 20525 29 Hops AR 31 20526 2 11 19.99 Malt - Barley WA Mabton 43877 1009 43877 1009 32 20527 2 12 19.99 Malt - Barley WA Mabton 33 20527 2 29 Hops 19.99 Malt- Rarley WA Mabton 43882 1008 43885 1008 43889 1008 43889 1009 43894 1008 43897 1008 43902 1009 43905 1008 Minneapolis Fayetteville Fayetteville 34 20528 1 3 MN 35 20529 3. 10 29 Hops AR 36 20530 3 19.99 Malt - Barley AR 37 20530 2 29 Hops AR Fayetteville Fayetteville 38 20531 3. 29 Ноps AR 39 20532 1 2 44.99 Malt-Wheat MN Minneapolis Minneapolis 40 20533 1 12 44.99 Malt - Wheat MN 41 20534 5 44.99 Malt - Wheat WA Mabton 43909 1009 43913 1009 43917 1008 43921 1009 44.99 Malt -Wheat 19.99 Malt - Barley 42 20535 AR Fayetteville 43 20536 12 WA Mabton 44 20537 29 Hops 44.99 Malt . Wheat WA Mabton 45 20538 1 Minneapolis Fayetteville Mabton Fayetteville MN 43925 1008 43929 1008 43932 1009 43932 1008 43935 1009 43935 1009 43939 1009 43942 1008 46 20539 6 29 Hops AR 19.99 Malt - Barley 29 Hops 47 20540 3 WA 48 20541 3. 10 AR 49 20541 3. 3 29 Hops AR Fayetteville 50 20542 1 6 29 Hops MN Minneapolis 51 20542 1 44.99 Malt - Wheat MN Minneapolis 52 20543 1. 44.99 Malt .Wheat MN Minneapolis 53 20544 4. 44.99 Malt - Wheat WA Mahton Required: 1. From which state were the most products purchased? O Arkansas O Minnesota O Washington 2. How many products were purchased from Arkansas? O 134 O 135 O 979 O 107 3. Which product had the largest proportion of purchase orders? O Malt-Wheat O Malt-Barley О Ноps 4. How many purchase orders were generated grand total (count, across all states and products)? O 152 O 98 O 52 О 344 1. Create the String Data sheet and work through the different ways of visualizing proportions and counts. 2. Create the Geographic Data sheet and work through symbol and filled maps for quantity purchased. Ask the Question: How do data types affect the way I can analyze data in Tableau? Master the Data: This lab is a continuation of Lab 3-2. Make sure to work through the Master the Data steps in Lab 3-2 before proceeding to this lab to ensure that you have imported the data from Lab 3-2 and changed all the data types appropriately according to Steps 1 and 2. Software needed • Tableau Screen capture tool (Windows: Snipping Tool; Mac: Cmd+Shift+4) Data: 3-3 Alt Data.twbx or you may use your solution file for Lab 3-2 Alt Data,xlsx Perform the Analysis: Refer to Lab 3-3 Alternate in the text for instructions and Lab 3-3 steps for each of the lab parts. Share the Story: You have now visualized a variety of different data types, compared different charts for analyzing and exploring categorical data, and created maps to analyze and explore geographic data. Part 1: Upload Your Files Part 2: Assessment D E 1 Purchase Order JD Purchase_Order_Date Purchase_Employee_D Supplier ID Quantity_Purchased - Raw_Materlal_Purchase_Price raw_materials description 19.99 Malt -Barley supplier st supplier city Fayetteville 43770 1009 43774 1009 43779 1009 2 20500 3 AR 3 20501 2 10 29 Ноps 29 Hops WA Mabton 4 20502 2. WA Mahton 43782 1008 43785 1009 43788 1008 43792 1009 43792 1009 43795 1009 43798 1009 43803 1009 43808 1009 43811 1008 43815 1a09 20503 44.99 Malt- Wheat Minneapolis 1 1 12 MN 6 20504 4 19.99 Malt - Barley MN Minneapolis 7. 20505 2 12 19.99 Malt - Barley WA Mabton 20506 5 19.99 Malt - Barley Minneapolis MN 9 20506 1 29 Hops MN Minneapolis 10 20507 1 1 19.99 Malt -Barley MN Minneapolis 19.99 Malt - Barley Fayetteville Minneapolis Mabton Fayetteville Fayetteville 11 20508 3 4 AR 12 20509 1 12 19.99 Malt - Barley IMN 13 20510 11 19.99 Malt- Barley WA 3. 6 29 Норs 19.99 Malt - Barley 14 20511 AR 15 20512 3 7 AR 43818 1008 43823 1009 43827 1009 43832 1008 43835 1009 43839 1009 43844 1008 43848 1008 43853 1008 43856 1009 43861 1009 43865 1009 43869 1008 43869 1009 16 20513 11 44.99 Malt -Wheat WA Mabton 17 20514 3 11 44.99 Malt - Wheat AR Fayetteville 18 20515 1 4 44.99 Malt - Wheat MN Minneapolis Minneapolis 19 20516 1 11 29 Hops MN 20 20517 10 19.99 Malt - Barley WA Mabton 21 20518 12 29 Ноps MN Minneapolis 1 19.99 Malt - Barley 29 Hops 19.99 Malt - Barley 44.99 Malt - Wheat 19.99 Malt- Barley 22 20519 WA Mabton Minneapolis Fayetteville Fayetteville Minneapolis 23 20520 1 12 MN 24 20521 AR 25 20522 3 10 AR 26 20523 1 MN 27 20524 1 19.99 Malt - Barley WA Mabton 28 20525 3. 5 44.99 Malt - Wheat AR Fayetteville 29 20525 3 2 44.99 Malt -Wheat AR Fayetteville Fayetteville 43869 1008 43874 1009 30 20525 29 Hops AR 31 20526 2 11 19.99 Malt - Barley WA Mabton 43877 1009 43877 1009 32 20527 2 12 19.99 Malt - Barley WA Mabton 33 20527 2 29 Hops 19.99 Malt- Rarley WA Mabton 43882 1008 43885 1008 43889 1008 43889 1009 43894 1008 43897 1008 43902 1009 43905 1008 Minneapolis Fayetteville Fayetteville 34 20528 1 3 MN 35 20529 3. 10 29 Hops AR 36 20530 3 19.99 Malt - Barley AR 37 20530 2 29 Hops AR Fayetteville Fayetteville 38 20531 3. 29 Ноps AR 39 20532 1 2 44.99 Malt-Wheat MN Minneapolis Minneapolis 40 20533 1 12 44.99 Malt - Wheat MN 41 20534 5 44.99 Malt - Wheat WA Mabton 43909 1009 43913 1009 43917 1008 43921 1009 44.99 Malt -Wheat 19.99 Malt - Barley 42 20535 AR Fayetteville 43 20536 12 WA Mabton 44 20537 29 Hops 44.99 Malt . Wheat WA Mabton 45 20538 1 Minneapolis Fayetteville Mabton Fayetteville MN 43925 1008 43929 1008 43932 1009 43932 1008 43935 1009 43935 1009 43939 1009 43942 1008 46 20539 6 29 Hops AR 19.99 Malt - Barley 29 Hops 47 20540 3 WA 48 20541 3. 10 AR 49 20541 3. 3 29 Hops AR Fayetteville 50 20542 1 6 29 Hops MN Minneapolis 51 20542 1 44.99 Malt - Wheat MN Minneapolis 52 20543 1. 44.99 Malt .Wheat MN Minneapolis 53 20544 4. 44.99 Malt - Wheat WA Mahton Required: 1. From which state were the most products purchased? O Arkansas O Minnesota O Washington 2. How many products were purchased from Arkansas? O 134 O 135 O 979 O 107 3. Which product had the largest proportion of purchase orders? O Malt-Wheat O Malt-Barley О Ноps 4. How many purchase orders were generated grand total (count, across all states and products)? O 152 O 98 O 52 О 344 1. Create the String Data sheet and work through the different ways of visualizing proportions and counts. 2. Create the Geographic Data sheet and work through symbol and filled maps for quantity purchased. Ask the Question: How do data types affect the way I can analyze data in Tableau? Master the Data: This lab is a continuation of Lab 3-2. Make sure to work through the Master the Data steps in Lab 3-2 before proceeding to this lab to ensure that you have imported the data from Lab 3-2 and changed all the data types appropriately according to Steps 1 and 2. Software needed • Tableau Screen capture tool (Windows: Snipping Tool; Mac: Cmd+Shift+4) Data: 3-3 Alt Data.twbx or you may use your solution file for Lab 3-2 Alt Data,xlsx Perform the Analysis: Refer to Lab 3-3 Alternate in the text for instructions and Lab 3-3 steps for each of the lab parts. Share the Story: You have now visualized a variety of different data types, compared different charts for analyzing and exploring categorical data, and created maps to analyze and explore geographic data. Part 1: Upload Your Files Part 2: Assessment D E 1 Purchase Order JD Purchase_Order_Date Purchase_Employee_D Supplier ID Quantity_Purchased - Raw_Materlal_Purchase_Price raw_materials description 19.99 Malt -Barley supplier st supplier city Fayetteville 43770 1009 43774 1009 43779 1009 2 20500 3 AR 3 20501 2 10 29 Ноps 29 Hops WA Mabton 4 20502 2. WA Mahton 43782 1008 43785 1009 43788 1008 43792 1009 43792 1009 43795 1009 43798 1009 43803 1009 43808 1009 43811 1008 43815 1a09 20503 44.99 Malt- Wheat Minneapolis 1 1 12 MN 6 20504 4 19.99 Malt - Barley MN Minneapolis 7. 20505 2 12 19.99 Malt - Barley WA Mabton 20506 5 19.99 Malt - Barley Minneapolis MN 9 20506 1 29 Hops MN Minneapolis 10 20507 1 1 19.99 Malt -Barley MN Minneapolis 19.99 Malt - Barley Fayetteville Minneapolis Mabton Fayetteville Fayetteville 11 20508 3 4 AR 12 20509 1 12 19.99 Malt - Barley IMN 13 20510 11 19.99 Malt- Barley WA 3. 6 29 Норs 19.99 Malt - Barley 14 20511 AR 15 20512 3 7 AR 43818 1008 43823 1009 43827 1009 43832 1008 43835 1009 43839 1009 43844 1008 43848 1008 43853 1008 43856 1009 43861 1009 43865 1009 43869 1008 43869 1009 16 20513 11 44.99 Malt -Wheat WA Mabton 17 20514 3 11 44.99 Malt - Wheat AR Fayetteville 18 20515 1 4 44.99 Malt - Wheat MN Minneapolis Minneapolis 19 20516 1 11 29 Hops MN 20 20517 10 19.99 Malt - Barley WA Mabton 21 20518 12 29 Ноps MN Minneapolis 1 19.99 Malt - Barley 29 Hops 19.99 Malt - Barley 44.99 Malt - Wheat 19.99 Malt- Barley 22 20519 WA Mabton Minneapolis Fayetteville Fayetteville Minneapolis 23 20520 1 12 MN 24 20521 AR 25 20522 3 10 AR 26 20523 1 MN 27 20524 1 19.99 Malt - Barley WA Mabton 28 20525 3. 5 44.99 Malt - Wheat AR Fayetteville 29 20525 3 2 44.99 Malt -Wheat AR Fayetteville Fayetteville 43869 1008 43874 1009 30 20525 29 Hops AR 31 20526 2 11 19.99 Malt - Barley WA Mabton 43877 1009 43877 1009 32 20527 2 12 19.99 Malt - Barley WA Mabton 33 20527 2 29 Hops 19.99 Malt- Rarley WA Mabton 43882 1008 43885 1008 43889 1008 43889 1009 43894 1008 43897 1008 43902 1009 43905 1008 Minneapolis Fayetteville Fayetteville 34 20528 1 3 MN 35 20529 3. 10 29 Hops AR 36 20530 3 19.99 Malt - Barley AR 37 20530 2 29 Hops AR Fayetteville Fayetteville 38 20531 3. 29 Ноps AR 39 20532 1 2 44.99 Malt-Wheat MN Minneapolis Minneapolis 40 20533 1 12 44.99 Malt - Wheat MN 41 20534 5 44.99 Malt - Wheat WA Mabton 43909 1009 43913 1009 43917 1008 43921 1009 44.99 Malt -Wheat 19.99 Malt - Barley 42 20535 AR Fayetteville 43 20536 12 WA Mabton 44 20537 29 Hops 44.99 Malt . Wheat WA Mabton 45 20538 1 Minneapolis Fayetteville Mabton Fayetteville MN 43925 1008 43929 1008 43932 1009 43932 1008 43935 1009 43935 1009 43939 1009 43942 1008 46 20539 6 29 Hops AR 19.99 Malt - Barley 29 Hops 47 20540 3 WA 48 20541 3. 10 AR 49 20541 3. 3 29 Hops AR Fayetteville 50 20542 1 6 29 Hops MN Minneapolis 51 20542 1 44.99 Malt - Wheat MN Minneapolis 52 20543 1. 44.99 Malt .Wheat MN Minneapolis 53 20544 4. 44.99 Malt - Wheat WA Mahton Required: 1. From which state were the most products purchased? O Arkansas O Minnesota O Washington 2. How many products were purchased from Arkansas? O 134 O 135 O 979 O 107 3. Which product had the largest proportion of purchase orders? O Malt-Wheat O Malt-Barley О Ноps 4. How many purchase orders were generated grand total (count, across all states and products)? O 152 O 98 O 52 О 344 1. Create the String Data sheet and work through the different ways of visualizing proportions and counts. 2. Create the Geographic Data sheet and work through symbol and filled maps for quantity purchased. Ask the Question: How do data types affect the way I can analyze data in Tableau? Master the Data: This lab is a continuation of Lab 3-2. Make sure to work through the Master the Data steps in Lab 3-2 before proceeding to this lab to ensure that you have imported the data from Lab 3-2 and changed all the data types appropriately according to Steps 1 and 2. Software needed • Tableau Screen capture tool (Windows: Snipping Tool; Mac: Cmd+Shift+4) Data: 3-3 Alt Data.twbx or you may use your solution file for Lab 3-2 Alt Data,xlsx Perform the Analysis: Refer to Lab 3-3 Alternate in the text for instructions and Lab 3-3 steps for each of the lab parts. Share the Story: You have now visualized a variety of different data types, compared different charts for analyzing and exploring categorical data, and created maps to analyze and explore geographic data. Part 1: Upload Your Files Part 2: Assessment D E 1 Purchase Order JD Purchase_Order_Date Purchase_Employee_D Supplier ID Quantity_Purchased - Raw_Materlal_Purchase_Price raw_materials description 19.99 Malt -Barley supplier st supplier city Fayetteville 43770 1009 43774 1009 43779 1009 2 20500 3 AR 3 20501 2 10 29 Ноps 29 Hops WA Mabton 4 20502 2. WA Mahton 43782 1008 43785 1009 43788 1008 43792 1009 43792 1009 43795 1009 43798 1009 43803 1009 43808 1009 43811 1008 43815 1a09 20503 44.99 Malt- Wheat Minneapolis 1 1 12 MN 6 20504 4 19.99 Malt - Barley MN Minneapolis 7. 20505 2 12 19.99 Malt - Barley WA Mabton 20506 5 19.99 Malt - Barley Minneapolis MN 9 20506 1 29 Hops MN Minneapolis 10 20507 1 1 19.99 Malt -Barley MN Minneapolis 19.99 Malt - Barley Fayetteville Minneapolis Mabton Fayetteville Fayetteville 11 20508 3 4 AR 12 20509 1 12 19.99 Malt - Barley IMN 13 20510 11 19.99 Malt- Barley WA 3. 6 29 Норs 19.99 Malt - Barley 14 20511 AR 15 20512 3 7 AR 43818 1008 43823 1009 43827 1009 43832 1008 43835 1009 43839 1009 43844 1008 43848 1008 43853 1008 43856 1009 43861 1009 43865 1009 43869 1008 43869 1009 16 20513 11 44.99 Malt -Wheat WA Mabton 17 20514 3 11 44.99 Malt - Wheat AR Fayetteville 18 20515 1 4 44.99 Malt - Wheat MN Minneapolis Minneapolis 19 20516 1 11 29 Hops MN 20 20517 10 19.99 Malt - Barley WA Mabton 21 20518 12 29 Ноps MN Minneapolis 1 19.99 Malt - Barley 29 Hops 19.99 Malt - Barley 44.99 Malt - Wheat 19.99 Malt- Barley 22 20519 WA Mabton Minneapolis Fayetteville Fayetteville Minneapolis 23 20520 1 12 MN 24 20521 AR 25 20522 3 10 AR 26 20523 1 MN 27 20524 1 19.99 Malt - Barley WA Mabton 28 20525 3. 5 44.99 Malt - Wheat AR Fayetteville 29 20525 3 2 44.99 Malt -Wheat AR Fayetteville Fayetteville 43869 1008 43874 1009 30 20525 29 Hops AR 31 20526 2 11 19.99 Malt - Barley WA Mabton 43877 1009 43877 1009 32 20527 2 12 19.99 Malt - Barley WA Mabton 33 20527 2 29 Hops 19.99 Malt- Rarley WA Mabton 43882 1008 43885 1008 43889 1008 43889 1009 43894 1008 43897 1008 43902 1009 43905 1008 Minneapolis Fayetteville Fayetteville 34 20528 1 3 MN 35 20529 3. 10 29 Hops AR 36 20530 3 19.99 Malt - Barley AR 37 20530 2 29 Hops AR Fayetteville Fayetteville 38 20531 3. 29 Ноps AR 39 20532 1 2 44.99 Malt-Wheat MN Minneapolis Minneapolis 40 20533 1 12 44.99 Malt - Wheat MN 41 20534 5 44.99 Malt - Wheat WA Mabton 43909 1009 43913 1009 43917 1008 43921 1009 44.99 Malt -Wheat 19.99 Malt - Barley 42 20535 AR Fayetteville 43 20536 12 WA Mabton 44 20537 29 Hops 44.99 Malt . Wheat WA Mabton 45 20538 1 Minneapolis Fayetteville Mabton Fayetteville MN 43925 1008 43929 1008 43932 1009 43932 1008 43935 1009 43935 1009 43939 1009 43942 1008 46 20539 6 29 Hops AR 19.99 Malt - Barley 29 Hops 47 20540 3 WA 48 20541 3. 10 AR 49 20541 3. 3 29 Hops AR Fayetteville 50 20542 1 6 29 Hops MN Minneapolis 51 20542 1 44.99 Malt - Wheat MN Minneapolis 52 20543 1. 44.99 Malt .Wheat MN Minneapolis 53 20544 4. 44.99 Malt - Wheat WA Mahton Required: 1. From which state were the most products purchased? O Arkansas O Minnesota O Washington 2. How many products were purchased from Arkansas? O 134 O 135 O 979 O 107 3. Which product had the largest proportion of purchase orders? O Malt-Wheat O Malt-Barley О Ноps 4. How many purchase orders were generated grand total (count, across all states and products)? O 152 O 98 O 52 О 344 1. Create the String Data sheet and work through the different ways of visualizing proportions and counts. 2. Create the Geographic Data sheet and work through symbol and filled maps for quantity purchased. Ask the Question: How do data types affect the way I can analyze data in Tableau? Master the Data: This lab is a continuation of Lab 3-2. Make sure to work through the Master the Data steps in Lab 3-2 before proceeding to this lab to ensure that you have imported the data from Lab 3-2 and changed all the data types appropriately according to Steps 1 and 2. Software needed • Tableau Screen capture tool (Windows: Snipping Tool; Mac: Cmd+Shift+4) Data: 3-3 Alt Data.twbx or you may use your solution file for Lab 3-2 Alt Data,xlsx Perform the Analysis: Refer to Lab 3-3 Alternate in the text for instructions and Lab 3-3 steps for each of the lab parts. Share the Story: You have now visualized a variety of different data types, compared different charts for analyzing and exploring categorical data, and created maps to analyze and explore geographic data. Part 1: Upload Your Files Part 2: Assessment D E 1 Purchase Order JD Purchase_Order_Date Purchase_Employee_D Supplier ID Quantity_Purchased - Raw_Materlal_Purchase_Price raw_materials description 19.99 Malt -Barley supplier st supplier city Fayetteville 43770 1009 43774 1009 43779 1009 2 20500 3 AR 3 20501 2 10 29 Ноps 29 Hops WA Mabton 4 20502 2. WA Mahton 43782 1008 43785 1009 43788 1008 43792 1009 43792 1009 43795 1009 43798 1009 43803 1009 43808 1009 43811 1008 43815 1a09 20503 44.99 Malt- Wheat Minneapolis 1 1 12 MN 6 20504 4 19.99 Malt - Barley MN Minneapolis 7. 20505 2 12 19.99 Malt - Barley WA Mabton 20506 5 19.99 Malt - Barley Minneapolis MN 9 20506 1 29 Hops MN Minneapolis 10 20507 1 1 19.99 Malt -Barley MN Minneapolis 19.99 Malt - Barley Fayetteville Minneapolis Mabton Fayetteville Fayetteville 11 20508 3 4 AR 12 20509 1 12 19.99 Malt - Barley IMN 13 20510 11 19.99 Malt- Barley WA 3. 6 29 Норs 19.99 Malt - Barley 14 20511 AR 15 20512 3 7 AR 43818 1008 43823 1009 43827 1009 43832 1008 43835 1009 43839 1009 43844 1008 43848 1008 43853 1008 43856 1009 43861 1009 43865 1009 43869 1008 43869 1009 16 20513 11 44.99 Malt -Wheat WA Mabton 17 20514 3 11 44.99 Malt - Wheat AR Fayetteville 18 20515 1 4 44.99 Malt - Wheat MN Minneapolis Minneapolis 19 20516 1 11 29 Hops MN 20 20517 10 19.99 Malt - Barley WA Mabton 21 20518 12 29 Ноps MN Minneapolis 1 19.99 Malt - Barley 29 Hops 19.99 Malt - Barley 44.99 Malt - Wheat 19.99 Malt- Barley 22 20519 WA Mabton Minneapolis Fayetteville Fayetteville Minneapolis 23 20520 1 12 MN 24 20521 AR 25 20522 3 10 AR 26 20523 1 MN 27 20524 1 19.99 Malt - Barley WA Mabton 28 20525 3. 5 44.99 Malt - Wheat AR Fayetteville 29 20525 3 2 44.99 Malt -Wheat AR Fayetteville Fayetteville 43869 1008 43874 1009 30 20525 29 Hops AR 31 20526 2 11 19.99 Malt - Barley WA Mabton 43877 1009 43877 1009 32 20527 2 12 19.99 Malt - Barley WA Mabton 33 20527 2 29 Hops 19.99 Malt- Rarley WA Mabton 43882 1008 43885 1008 43889 1008 43889 1009 43894 1008 43897 1008 43902 1009 43905 1008 Minneapolis Fayetteville Fayetteville 34 20528 1 3 MN 35 20529 3. 10 29 Hops AR 36 20530 3 19.99 Malt - Barley AR 37 20530 2 29 Hops AR Fayetteville Fayetteville 38 20531 3. 29 Ноps AR 39 20532 1 2 44.99 Malt-Wheat MN Minneapolis Minneapolis 40 20533 1 12 44.99 Malt - Wheat MN 41 20534 5 44.99 Malt - Wheat WA Mabton 43909 1009 43913 1009 43917 1008 43921 1009 44.99 Malt -Wheat 19.99 Malt - Barley 42 20535 AR Fayetteville 43 20536 12 WA Mabton 44 20537 29 Hops 44.99 Malt . Wheat WA Mabton 45 20538 1 Minneapolis Fayetteville Mabton Fayetteville MN 43925 1008 43929 1008 43932 1009 43932 1008 43935 1009 43935 1009 43939 1009 43942 1008 46 20539 6 29 Hops AR 19.99 Malt - Barley 29 Hops 47 20540 3 WA 48 20541 3. 10 AR 49 20541 3. 3 29 Hops AR Fayetteville 50 20542 1 6 29 Hops MN Minneapolis 51 20542 1 44.99 Malt - Wheat MN Minneapolis 52 20543 1. 44.99 Malt .Wheat MN Minneapolis 53 20544 4. 44.99 Malt - Wheat WA Mahton Required: 1. From which state were the most products purchased? O Arkansas O Minnesota O Washington 2. How many products were purchased from Arkansas? O 134 O 135 O 979 O 107 3. Which product had the largest proportion of purchase orders? O Malt-Wheat O Malt-Barley О Ноps 4. How many purchase orders were generated grand total (count, across all states and products)? O 152 O 98 O 52 О 344 1. Create the String Data sheet and work through the different ways of visualizing proportions and counts. 2. Create the Geographic Data sheet and work through symbol and filled maps for quantity purchased. Ask the Question: How do data types affect the way I can analyze data in Tableau? Master the Data: This lab is a continuation of Lab 3-2. Make sure to work through the Master the Data steps in Lab 3-2 before proceeding to this lab to ensure that you have imported the data from Lab 3-2 and changed all the data types appropriately according to Steps 1 and 2. Software needed • Tableau Screen capture tool (Windows: Snipping Tool; Mac: Cmd+Shift+4) Data: 3-3 Alt Data.twbx or you may use your solution file for Lab 3-2 Alt Data,xlsx Perform the Analysis: Refer to Lab 3-3 Alternate in the text for instructions and Lab 3-3 steps for each of the lab parts. Share the Story: You have now visualized a variety of different data types, compared different charts for analyzing and exploring categorical data, and created maps to analyze and explore geographic data. Part 1: Upload Your Files Part 2: Assessment D E 1 Purchase Order JD Purchase_Order_Date Purchase_Employee_D Supplier ID Quantity_Purchased - Raw_Materlal_Purchase_Price raw_materials description 19.99 Malt -Barley supplier st supplier city Fayetteville 43770 1009 43774 1009 43779 1009 2 20500 3 AR 3 20501 2 10 29 Ноps 29 Hops WA Mabton 4 20502 2. WA Mahton 43782 1008 43785 1009 43788 1008 43792 1009 43792 1009 43795 1009 43798 1009 43803 1009 43808 1009 43811 1008 43815 1a09 20503 44.99 Malt- Wheat Minneapolis 1 1 12 MN 6 20504 4 19.99 Malt - Barley MN Minneapolis 7. 20505 2 12 19.99 Malt - Barley WA Mabton 20506 5 19.99 Malt - Barley Minneapolis MN 9 20506 1 29 Hops MN Minneapolis 10 20507 1 1 19.99 Malt -Barley MN Minneapolis 19.99 Malt - Barley Fayetteville Minneapolis Mabton Fayetteville Fayetteville 11 20508 3 4 AR 12 20509 1 12 19.99 Malt - Barley IMN 13 20510 11 19.99 Malt- Barley WA 3. 6 29 Норs 19.99 Malt - Barley 14 20511 AR 15 20512 3 7 AR 43818 1008 43823 1009 43827 1009 43832 1008 43835 1009 43839 1009 43844 1008 43848 1008 43853 1008 43856 1009 43861 1009 43865 1009 43869 1008 43869 1009 16 20513 11 44.99 Malt -Wheat WA Mabton 17 20514 3 11 44.99 Malt - Wheat AR Fayetteville 18 20515 1 4 44.99 Malt - Wheat MN Minneapolis Minneapolis 19 20516 1 11 29 Hops MN 20 20517 10 19.99 Malt - Barley WA Mabton 21 20518 12 29 Ноps MN Minneapolis 1 19.99 Malt - Barley 29 Hops 19.99 Malt - Barley 44.99 Malt - Wheat 19.99 Malt- Barley 22 20519 WA Mabton Minneapolis Fayetteville Fayetteville Minneapolis 23 20520 1 12 MN 24 20521 AR 25 20522 3 10 AR 26 20523 1 MN 27 20524 1 19.99 Malt - Barley WA Mabton 28 20525 3. 5 44.99 Malt - Wheat AR Fayetteville 29 20525 3 2 44.99 Malt -Wheat AR Fayetteville Fayetteville 43869 1008 43874 1009 30 20525 29 Hops AR 31 20526 2 11 19.99 Malt - Barley WA Mabton 43877 1009 43877 1009 32 20527 2 12 19.99 Malt - Barley WA Mabton 33 20527 2 29 Hops 19.99 Malt- Rarley WA Mabton 43882 1008 43885 1008 43889 1008 43889 1009 43894 1008 43897 1008 43902 1009 43905 1008 Minneapolis Fayetteville Fayetteville 34 20528 1 3 MN 35 20529 3. 10 29 Hops AR 36 20530 3 19.99 Malt - Barley AR 37 20530 2 29 Hops AR Fayetteville Fayetteville 38 20531 3. 29 Ноps AR 39 20532 1 2 44.99 Malt-Wheat MN Minneapolis Minneapolis 40 20533 1 12 44.99 Malt - Wheat MN 41 20534 5 44.99 Malt - Wheat WA Mabton 43909 1009 43913 1009 43917 1008 43921 1009 44.99 Malt -Wheat 19.99 Malt - Barley 42 20535 AR Fayetteville 43 20536 12 WA Mabton 44 20537 29 Hops 44.99 Malt . Wheat WA Mabton 45 20538 1 Minneapolis Fayetteville Mabton Fayetteville MN 43925 1008 43929 1008 43932 1009 43932 1008 43935 1009 43935 1009 43939 1009 43942 1008 46 20539 6 29 Hops AR 19.99 Malt - Barley 29 Hops 47 20540 3 WA 48 20541 3. 10 AR 49 20541 3. 3 29 Hops AR Fayetteville 50 20542 1 6 29 Hops MN Minneapolis 51 20542 1 44.99 Malt - Wheat MN Minneapolis 52 20543 1. 44.99 Malt .Wheat MN Minneapolis 53 20544 4. 44.99 Malt - Wheat WA Mahton Required: 1. From which state were the most products purchased? O Arkansas O Minnesota O Washington 2. How many products were purchased from Arkansas? O 134 O 135 O 979 O 107 3. Which product had the largest proportion of purchase orders? O Malt-Wheat O Malt-Barley О Ноps 4. How many purchase orders were generated grand total (count, across all states and products)? O 152 O 98 O 52 О 344 1. Create the String Data sheet and work through the different ways of visualizing proportions and counts. 2. Create the Geographic Data sheet and work through symbol and filled maps for quantity purchased. Ask the Question: How do data types affect the way I can analyze data in Tableau? Master the Data: This lab is a continuation of Lab 3-2. Make sure to work through the Master the Data steps in Lab 3-2 before proceeding to this lab to ensure that you have imported the data from Lab 3-2 and changed all the data types appropriately according to Steps 1 and 2. Software needed • Tableau Screen capture tool (Windows: Snipping Tool; Mac: Cmd+Shift+4) Data: 3-3 Alt Data.twbx or you may use your solution file for Lab 3-2 Alt Data,xlsx Perform the Analysis: Refer to Lab 3-3 Alternate in the text for instructions and Lab 3-3 steps for each of the lab parts. Share the Story: You have now visualized a variety of different data types, compared different charts for analyzing and exploring categorical data, and created maps to analyze and explore geographic data. Part 1: Upload Your Files Part 2: Assessment D E 1 Purchase Order JD Purchase_Order_Date Purchase_Employee_D Supplier ID Quantity_Purchased - Raw_Materlal_Purchase_Price raw_materials description 19.99 Malt -Barley supplier st supplier city Fayetteville 43770 1009 43774 1009 43779 1009 2 20500 3 AR 3 20501 2 10 29 Ноps 29 Hops WA Mabton 4 20502 2. WA Mahton 43782 1008 43785 1009 43788 1008 43792 1009 43792 1009 43795 1009 43798 1009 43803 1009 43808 1009 43811 1008 43815 1a09 20503 44.99 Malt- Wheat Minneapolis 1 1 12 MN 6 20504 4 19.99 Malt - Barley MN Minneapolis 7. 20505 2 12 19.99 Malt - Barley WA Mabton 20506 5 19.99 Malt - Barley Minneapolis MN 9 20506 1 29 Hops MN Minneapolis 10 20507 1 1 19.99 Malt -Barley MN Minneapolis 19.99 Malt - Barley Fayetteville Minneapolis Mabton Fayetteville Fayetteville 11 20508 3 4 AR 12 20509 1 12 19.99 Malt - Barley IMN 13 20510 11 19.99 Malt- Barley WA 3. 6 29 Норs 19.99 Malt - Barley 14 20511 AR 15 20512 3 7 AR 43818 1008 43823 1009 43827 1009 43832 1008 43835 1009 43839 1009 43844 1008 43848 1008 43853 1008 43856 1009 43861 1009 43865 1009 43869 1008 43869 1009 16 20513 11 44.99 Malt -Wheat WA Mabton 17 20514 3 11 44.99 Malt - Wheat AR Fayetteville 18 20515 1 4 44.99 Malt - Wheat MN Minneapolis Minneapolis 19 20516 1 11 29 Hops MN 20 20517 10 19.99 Malt - Barley WA Mabton 21 20518 12 29 Ноps MN Minneapolis 1 19.99 Malt - Barley 29 Hops 19.99 Malt - Barley 44.99 Malt - Wheat 19.99 Malt- Barley 22 20519 WA Mabton Minneapolis Fayetteville Fayetteville Minneapolis 23 20520 1 12 MN 24 20521 AR 25 20522 3 10 AR 26 20523 1 MN 27 20524 1 19.99 Malt - Barley WA Mabton 28 20525 3. 5 44.99 Malt - Wheat AR Fayetteville 29 20525 3 2 44.99 Malt -Wheat AR Fayetteville Fayetteville 43869 1008 43874 1009 30 20525 29 Hops AR 31 20526 2 11 19.99 Malt - Barley WA Mabton 43877 1009 43877 1009 32 20527 2 12 19.99 Malt - Barley WA Mabton 33 20527 2 29 Hops 19.99 Malt- Rarley WA Mabton 43882 1008 43885 1008 43889 1008 43889 1009 43894 1008 43897 1008 43902 1009 43905 1008 Minneapolis Fayetteville Fayetteville 34 20528 1 3 MN 35 20529 3. 10 29 Hops AR 36 20530 3 19.99 Malt - Barley AR 37 20530 2 29 Hops AR Fayetteville Fayetteville 38 20531 3. 29 Ноps AR 39 20532 1 2 44.99 Malt-Wheat MN Minneapolis Minneapolis 40 20533 1 12 44.99 Malt - Wheat MN 41 20534 5 44.99 Malt - Wheat WA Mabton 43909 1009 43913 1009 43917 1008 43921 1009 44.99 Malt -Wheat 19.99 Malt - Barley 42 20535 AR Fayetteville 43 20536 12 WA Mabton 44 20537 29 Hops 44.99 Malt . Wheat WA Mabton 45 20538 1 Minneapolis Fayetteville Mabton Fayetteville MN 43925 1008 43929 1008 43932 1009 43932 1008 43935 1009 43935 1009 43939 1009 43942 1008 46 20539 6 29 Hops AR 19.99 Malt - Barley 29 Hops 47 20540 3 WA 48 20541 3. 10 AR 49 20541 3. 3 29 Hops AR Fayetteville 50 20542 1 6 29 Hops MN Minneapolis 51 20542 1 44.99 Malt - Wheat MN Minneapolis 52 20543 1. 44.99 Malt .Wheat MN Minneapolis 53 20544 4. 44.99 Malt - Wheat WA Mahton Required: 1. From which state were the most products purchased? O Arkansas O Minnesota O Washington 2. How many products were purchased from Arkansas? O 134 O 135 O 979 O 107 3. Which product had the largest proportion of purchase orders? O Malt-Wheat O Malt-Barley О Ноps 4. How many purchase orders were generated grand total (count, across all states and products)? O 152 O 98 O 52 О 344 1. Create the String Data sheet and work through the different ways of visualizing proportions and counts. 2. Create the Geographic Data sheet and work through symbol and filled maps for quantity purchased. Ask the Question: How do data types affect the way I can analyze data in Tableau? Master the Data: This lab is a continuation of Lab 3-2. Make sure to work through the Master the Data steps in Lab 3-2 before proceeding to this lab to ensure that you have imported the data from Lab 3-2 and changed all the data types appropriately according to Steps 1 and 2. Software needed • Tableau Screen capture tool (Windows: Snipping Tool; Mac: Cmd+Shift+4) Data: 3-3 Alt Data.twbx or you may use your solution file for Lab 3-2 Alt Data,xlsx Perform the Analysis: Refer to Lab 3-3 Alternate in the text for instructions and Lab 3-3 steps for each of the lab parts. Share the Story: You have now visualized a variety of different data types, compared different charts for analyzing and exploring categorical data, and created maps to analyze and explore geographic data. Part 1: Upload Your Files Part 2: Assessment D E 1 Purchase Order JD Purchase_Order_Date Purchase_Employee_D Supplier ID Quantity_Purchased - Raw_Materlal_Purchase_Price raw_materials description 19.99 Malt -Barley supplier st supplier city Fayetteville 43770 1009 43774 1009 43779 1009 2 20500 3 AR 3 20501 2 10 29 Ноps 29 Hops WA Mabton 4 20502 2. WA Mahton 43782 1008 43785 1009 43788 1008 43792 1009 43792 1009 43795 1009 43798 1009 43803 1009 43808 1009 43811 1008 43815 1a09 20503 44.99 Malt- Wheat Minneapolis 1 1 12 MN 6 20504 4 19.99 Malt - Barley MN Minneapolis 7. 20505 2 12 19.99 Malt - Barley WA Mabton 20506 5 19.99 Malt - Barley Minneapolis MN 9 20506 1 29 Hops MN Minneapolis 10 20507 1 1 19.99 Malt -Barley MN Minneapolis 19.99 Malt - Barley Fayetteville Minneapolis Mabton Fayetteville Fayetteville 11 20508 3 4 AR 12 20509 1 12 19.99 Malt - Barley IMN 13 20510 11 19.99 Malt- Barley WA 3. 6 29 Норs 19.99 Malt - Barley 14 20511 AR 15 20512 3 7 AR 43818 1008 43823 1009 43827 1009 43832 1008 43835 1009 43839 1009 43844 1008 43848 1008 43853 1008 43856 1009 43861 1009 43865 1009 43869 1008 43869 1009 16 20513 11 44.99 Malt -Wheat WA Mabton 17 20514 3 11 44.99 Malt - Wheat AR Fayetteville 18 20515 1 4 44.99 Malt - Wheat MN Minneapolis Minneapolis 19 20516 1 11 29 Hops MN 20 20517 10 19.99 Malt - Barley WA Mabton 21 20518 12 29 Ноps MN Minneapolis 1 19.99 Malt - Barley 29 Hops 19.99 Malt - Barley 44.99 Malt - Wheat 19.99 Malt- Barley 22 20519 WA Mabton Minneapolis Fayetteville Fayetteville Minneapolis 23 20520 1 12 MN 24 20521 AR 25 20522 3 10 AR 26 20523 1 MN 27 20524 1 19.99 Malt - Barley WA Mabton 28 20525 3. 5 44.99 Malt - Wheat AR Fayetteville 29 20525 3 2 44.99 Malt -Wheat AR Fayetteville Fayetteville 43869 1008 43874 1009 30 20525 29 Hops AR 31 20526 2 11 19.99 Malt - Barley WA Mabton 43877 1009 43877 1009 32 20527 2 12 19.99 Malt - Barley WA Mabton 33 20527 2 29 Hops 19.99 Malt- Rarley WA Mabton 43882 1008 43885 1008 43889 1008 43889 1009 43894 1008 43897 1008 43902 1009 43905 1008 Minneapolis Fayetteville Fayetteville 34 20528 1 3 MN 35 20529 3. 10 29 Hops AR 36 20530 3 19.99 Malt - Barley AR 37 20530 2 29 Hops AR Fayetteville Fayetteville 38 20531 3. 29 Ноps AR 39 20532 1 2 44.99 Malt-Wheat MN Minneapolis Minneapolis 40 20533 1 12 44.99 Malt - Wheat MN 41 20534 5 44.99 Malt - Wheat WA Mabton 43909 1009 43913 1009 43917 1008 43921 1009 44.99 Malt -Wheat 19.99 Malt - Barley 42 20535 AR Fayetteville 43 20536 12 WA Mabton 44 20537 29 Hops 44.99 Malt . Wheat WA Mabton 45 20538 1 Minneapolis Fayetteville Mabton Fayetteville MN 43925 1008 43929 1008 43932 1009 43932 1008 43935 1009 43935 1009 43939 1009 43942 1008 46 20539 6 29 Hops AR 19.99 Malt - Barley 29 Hops 47 20540 3 WA 48 20541 3. 10 AR 49 20541 3. 3 29 Hops AR Fayetteville 50 20542 1 6 29 Hops MN Minneapolis 51 20542 1 44.99 Malt - Wheat MN Minneapolis 52 20543 1. 44.99 Malt .Wheat MN Minneapolis 53 20544 4. 44.99 Malt - Wheat WA Mahton Required: 1. From which state were the most products purchased? O Arkansas O Minnesota O Washington 2. How many products were purchased from Arkansas? O 134 O 135 O 979 O 107 3. Which product had the largest proportion of purchase orders? O Malt-Wheat O Malt-Barley О Ноps 4. How many purchase orders were generated grand total (count, across all states and products)? O 152 O 98 O 52 О 344
Expert Answer:
Answer rating: 100% (QA)
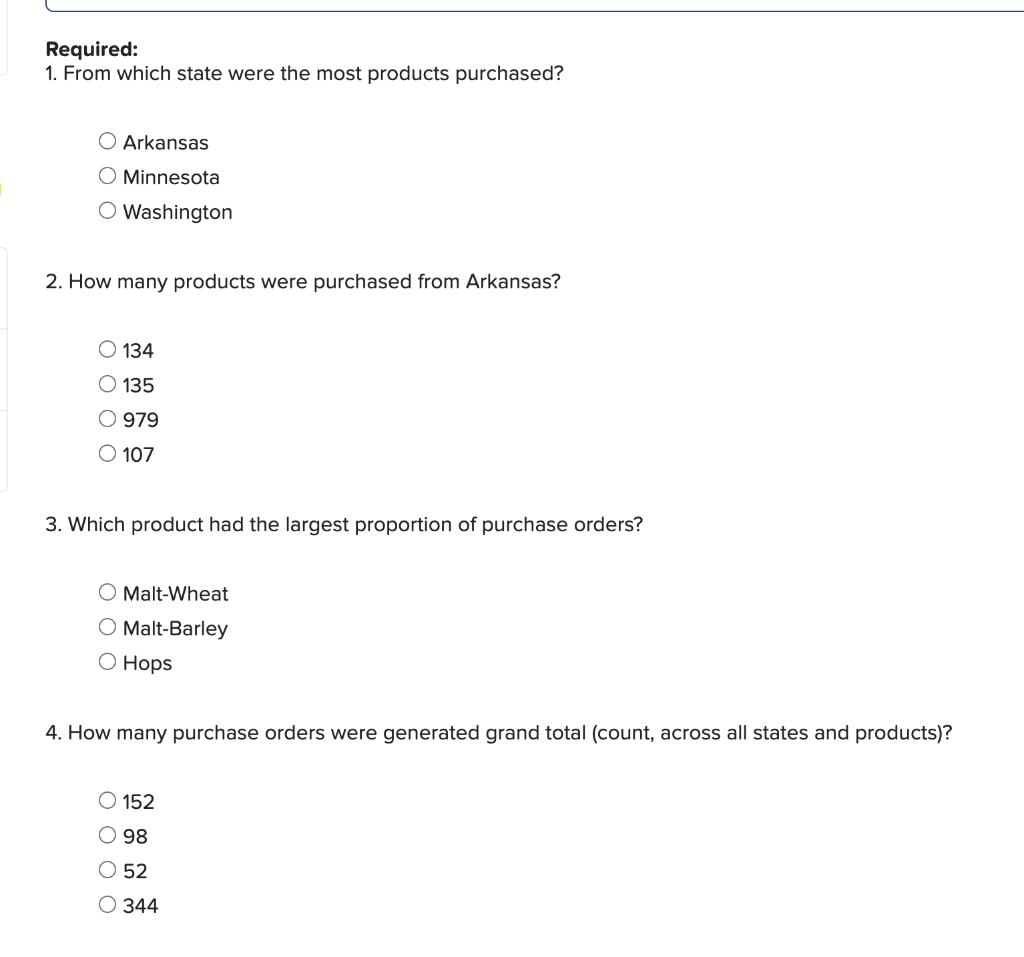
Answer to question 1 Option 3 is correct ie Washington Supplier State T... View the full answer

Related Book For 

Fundamental Managerial Accounting Concepts
ISBN: 978-0078110894
6th Edition
Authors: Edmonds, Tsay, olds
Posted Date:
Students also viewed these mathematics questions
-
The norm of a linear transformation TA: Rn Rn can be defined by where the maximum is taken over all nonzero x in Rn. (The subscript indicates that the norm of the linear transformation on the left is...
-
Suppose that f: Rn R and g: Rn Rn are differentiable on Rn and that there exist r > 0 and a Rn such that Dg(x) is the identity matrix, I, for all x Br(a). Prove that there is a function h: Br(a) {a}...
-
Let 5: Rn Rn and T: Rn Rn be linear transformations with matrices A and B respectively. [Theorem 3.] (a) Show that B2 = B if and only if T2 = 7 (where T2 means T o T). (b) Show that B2 = 1 if and...
-
Who are the uppers in your life? Do you have any downers or vultures?
-
A cassette tape storage device has been designed for mass-storage [1]. It is necessary to control the velocity of the tape accurately. The speed control of the tape drive is represented by the system...
-
Determine the amount of taxable income that should be reported by a cash-basis taxpayer in 2021 in each of the following independent cases: a. A taxpayer completes $500 of accounting services in...
-
0.8365 Use the Standard Normal Table or technology to find the z-score that corresponds to the cumulative area or percentile. Table 4-Standard Normal Distribution Arca Z 0 Z .09 .08 .07 .06 .05 .04...
-
1. Data on the amount of the customers' shopping by using an account card and whether they decided to upgrade their account from silver status to platinum status after receiving the upgrade offer is...
-
Pina is a manufacturer with a purpose: it creates durable, yet affordable, duffel bags with many functional pockets and accessories to encourage people of all ages to travel. In the process of making...
-
Assume it is Monday, May 1, 2020, the first business day of the month, and you have just been hired as the accountant for Alpine Company, which operates with monthly accounting periods. All of the...
-
2. The American Heart Association reported the following breakdown of expenses. Develop an appropriate chart or graph and write a brief report summarizing the information. Type of tax (4)...
-
You are drawing five cards from a standard deck of cards with replacement. You win if you draw at least three red cards in five draws. What is the probability of your winning?
-
Alexis de Tocqueville once stated, The Americans have applied to the sexes the great principle of political economy which governs the manufacturers of our age, by carefully dividing the duties of men...
-
Say we toss two six-sided dice and let the random variable be the total number of dots observed. (a) Calculate both the probability and the cumulative probability distributions. (b) Draw a graph...
-
In \((x, y, z)\) notation, four ideal monatomic gas particles have the velocities \(\vec{v}_{1}=(-6.0,5.0,1.0) \mathrm{m} / \mathrm{s}, \vec{v}_{2}=\) \((4.0,5.0,-2.0 \mathrm{~m} / \mathrm{s}),...
-
Answer question 57 when S = $110. How does a change in the value of the stock affect the value of the call option? Question 57 You are given the following information about a stock: Calculate the...
-
A person wants to invest $ 1 6 , 0 0 0 for 2 years and is considering two different investments. The first investment, a money market fund, pays a guaranteed 6 . 2 % interest compounded daily. The...
-
What is the maximum volume of 0.25 M sodium hypochlorite solution (NaOCl, laundry bleach) that can be prepared by dilution of 1.00 L of 0.80 M NaOCl?
-
What is the objective of allocating indirect manufacturing overhead costs to the product?
-
How does the concept of predominant control as opposed to that of absolute control apply to responsibility accounting?
-
What are three approaches to establishing transfer prices? List the most desirable approach first and the least desirable last.
-
Entrepreneur magazine ranks franchises. Among the factors that the magazine uses in its rankings are growth rate, number of locations, start-up costs, and financial stability. A recent ranking listed...
-
The following 20 observations are for two quantitative variables, x and y. a. Create a scatter chart for these 20 observations. b. Fit a linear trendline to the 20 observations. What can you say...
-
Blatt Consulting Services is interested in comparing the number of customer accounts managed by its consultants. The chart below is a default chart produced in Excel. a. Which preattentive attributes...

Study smarter with the SolutionInn App