

Question: After attempting to replicate the study in Q6, a researcher produced the following graph in their output: 68 66 Text Messagers 64 62 Controls 60

After attempting to replicate the study in Q6, a researcher produced the following graph in their output:
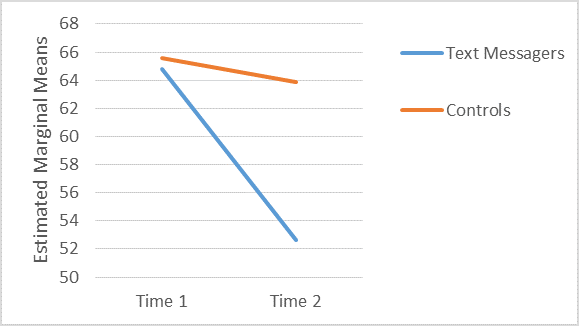
68 66 Text Messagers 64 62 Controls 60 Estimated Marginal Means 58 56 54 52 50 Time 1 Time 2
Step by Step Solution
There are 3 Steps involved in it
1 Expert Approved Answer
Step: 1 Unlock

Question Has Been Solved by an Expert!
Get step-by-step solutions from verified subject matter experts
Step: 2 Unlock
Step: 3 Unlock