

Question: After creating the charts then your paper should answer the following questions: 1. What does the X-bar chart tell you about the process you are
After creating the charts then your paper should answer the following questions: 1. What does the X-bar chart tell you about the process you are trying to control? 2. What does the R chart tell you about the process you are trying to control? 3. What did you learn about the process from the charts? 4. What do you need to do to make sure the process stays in control?
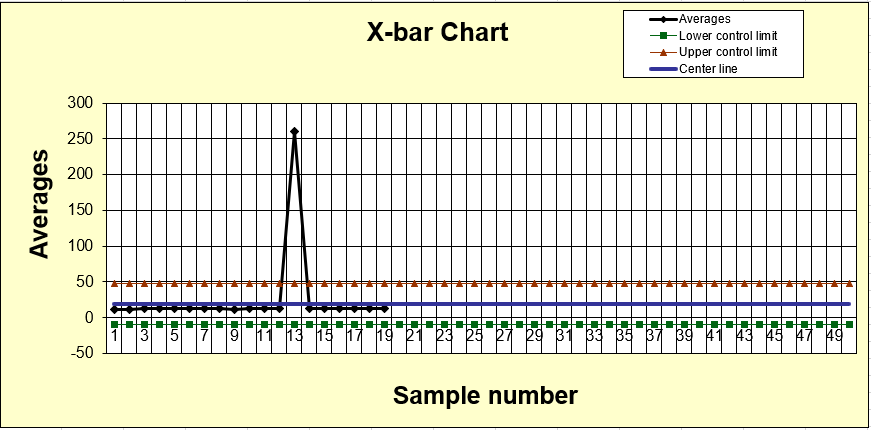
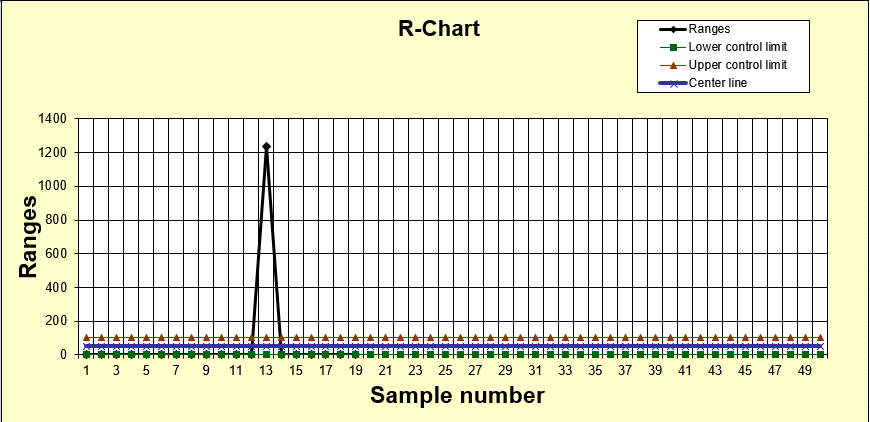
O CH 6H IT. 47 | CS [J -Averages +Lower controllimit -Upper controllimit Center line CH LE 1 [ 4 13 [. 27 29 31 33 35 37 39 LII TI I. [ 1 [J Sample number LE X-bar Chart 1 CTX CH LE CE Li AL [] 17 19 14 CH To IT Blo LE VI 1 HC IL NIC Tz 300 0 250 200 150 100 50 -50 s R-Chart -Ranges Lower control limit Upper controllimit Center line 1400 1200 1000 800 Ranges 600 400 200 IT 24 C! 1 LE EC NA C TIT TC LE 10 60 C 13 2 IN 11 TO II UT 111 G C LLC ITICA TO 1 3 5 7 9 11 13 15 17 19 21 23 25 27 29 31 33 35 37 39 41 43 45 47 49 Sample number
Step by Step Solution
There are 3 Steps involved in it
1 Expert Approved Answer
Step: 1 Unlock

Question Has Been Solved by an Expert!
Get step-by-step solutions from verified subject matter experts
Step: 2 Unlock
Step: 3 Unlock