

Question: After you read the article Understanding Perceptual Map, please follow the instruction in the article and draw two perceptual maps using the following data. 1
After you read the article "Understanding Perceptual Map", please follow the instruction in the article and draw two perceptual maps using the following data.
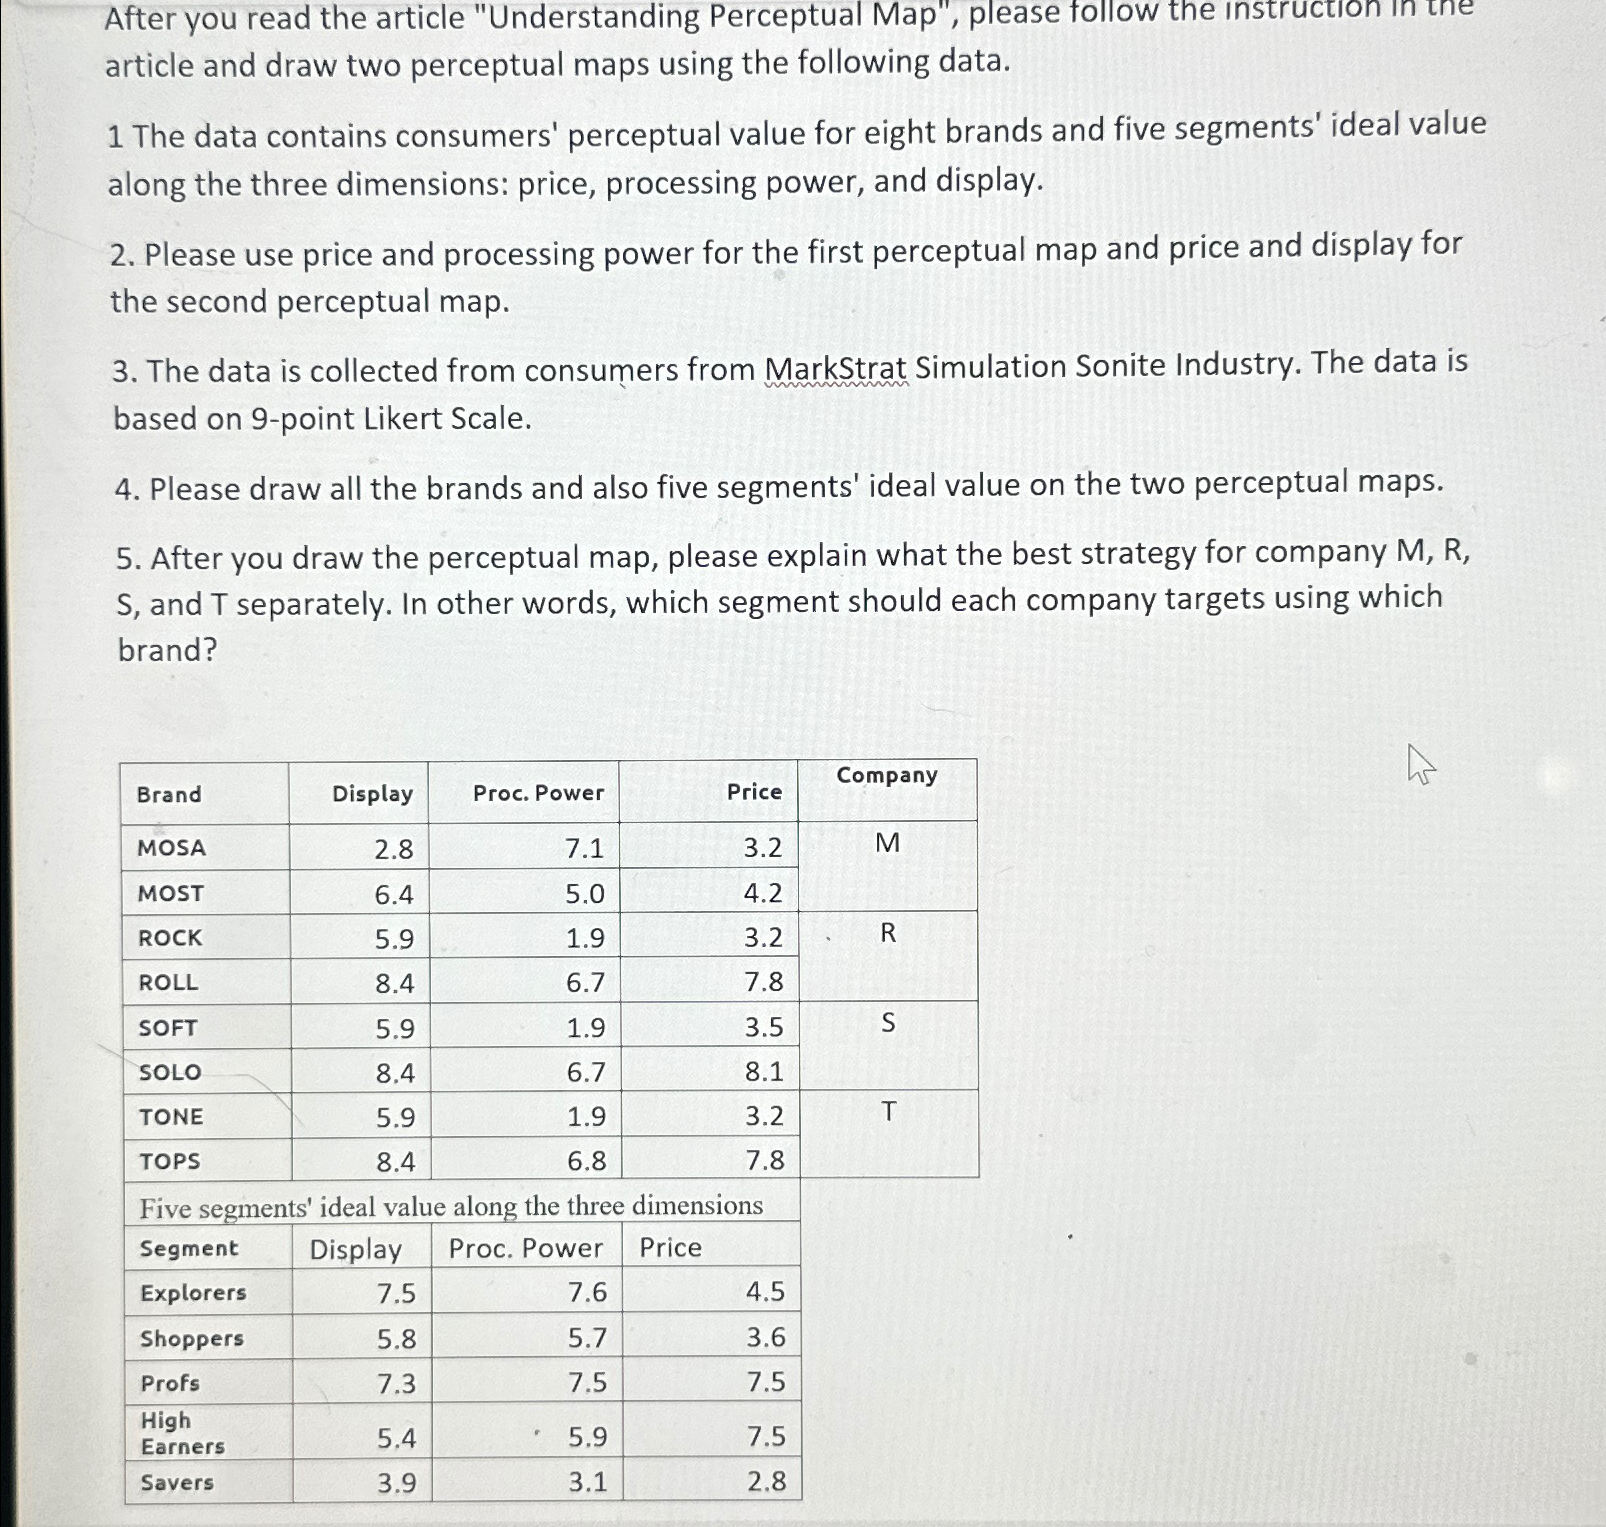
The data contains consumers' perceptual value for eight brands and five segments' ideal value along the three dimensions: price, processing power, and display.
Please use price and processing power for the first perceptual map and price and display for the second perceptual map.
The data is collected from consumers from MarkStrat Simulation Sonite Industry. The data is based on point Likert Scale.
Please draw all the brands and also five segments' ideal value on the two perceptual maps.
After you draw the perceptual map, please explain what the best strategy for company and separately. In other words, which segment should each company targets using which brand?
tableBrandDisplay,Proc. Power,Price,CompanyMOSAMMOSTROCK
Step by Step Solution
There are 3 Steps involved in it
1 Expert Approved Answer
Step: 1 Unlock

Question Has Been Solved by an Expert!
Get step-by-step solutions from verified subject matter experts
Step: 2 Unlock
Step: 3 Unlock