

Question: Age: Use the random sample data in the graph above to answer: a. How many people in the sample were under 50.5 years old? b.
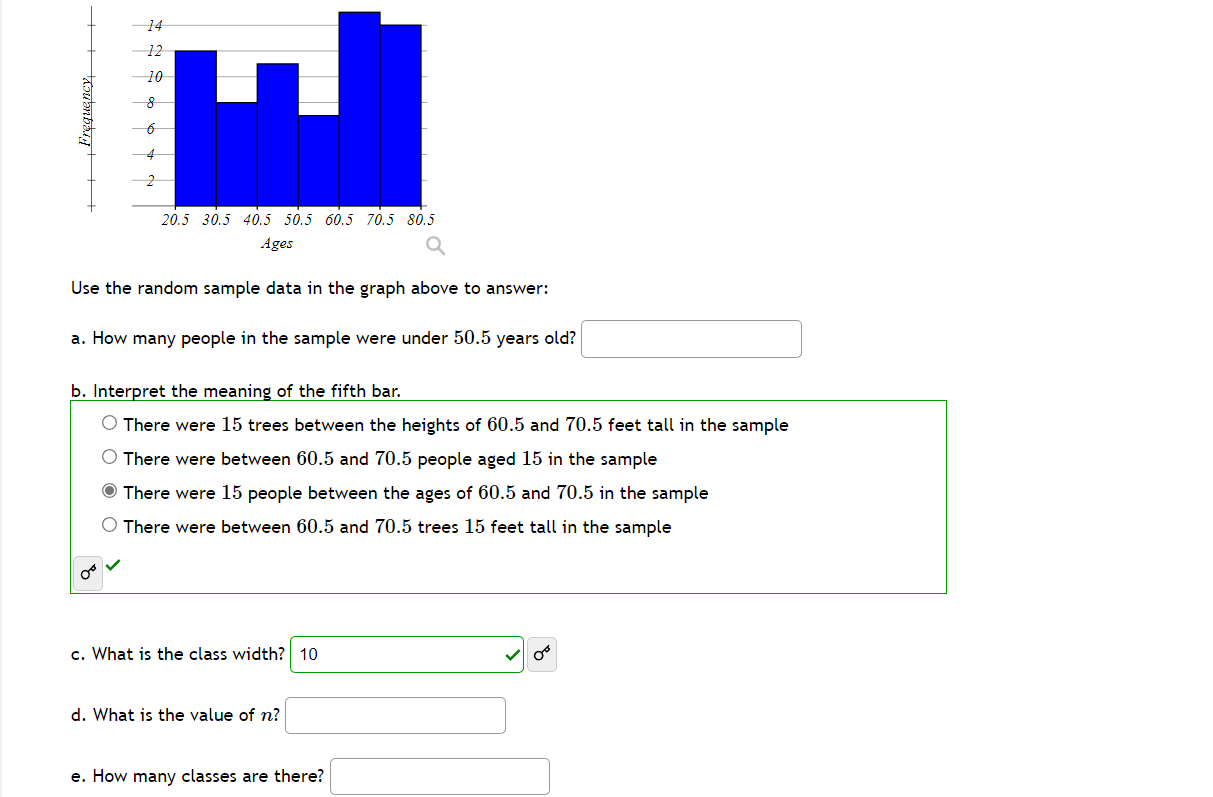

Age: Use the random sample data in the graph above to answer: a. How many people in the sample were under 50.5 years old? b. Interpret the meaning of the fifth bar. C" There were 15 trees between the heights of 605 and 70.5 feet tall in the sample {233' There were between 60.5 and 70.5 people aged 15 in the sample '33? There were 15 people between the ages of 605 and 70.5 in the sample {23' There were between 60.5 and 70.5 trees 15 feet tall in the sample doa/ c. What is the class width? 10 J 0' d. What is the value of n? e. How many classes are there
Step by Step Solution
There are 3 Steps involved in it
1 Expert Approved Answer
Step: 1 Unlock

Question Has Been Solved by an Expert!
Get step-by-step solutions from verified subject matter experts
Step: 2 Unlock
Step: 3 Unlock