

Question: AGEC 440 Homework #2 100 Points Available This Homework Will Use the Homework 2 Excel Data Sheet (Data Tab) Please carry any decimals out two
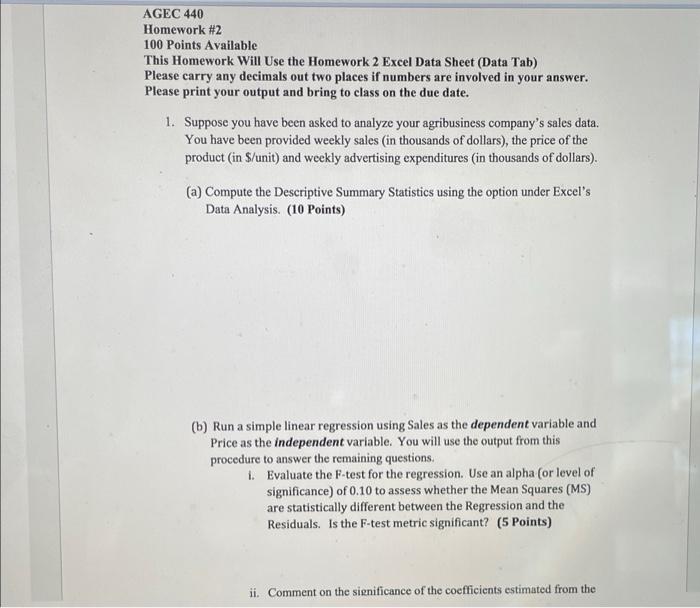
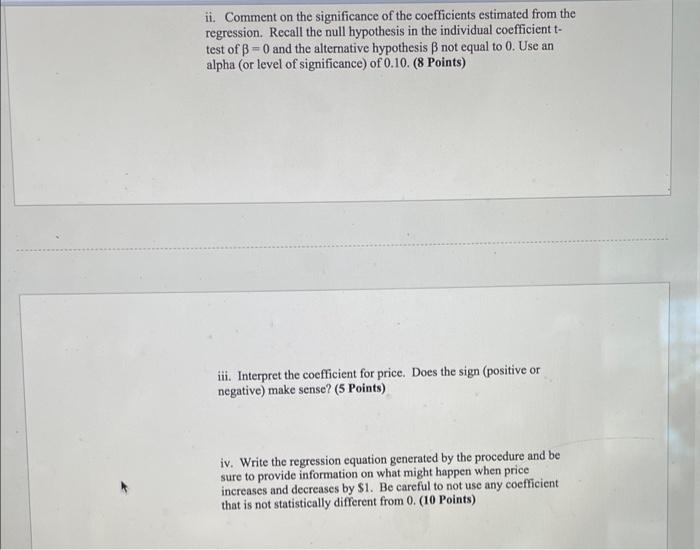
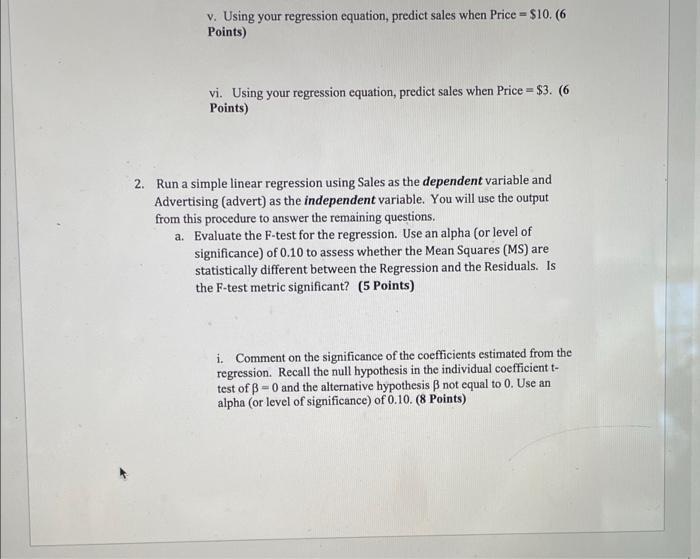
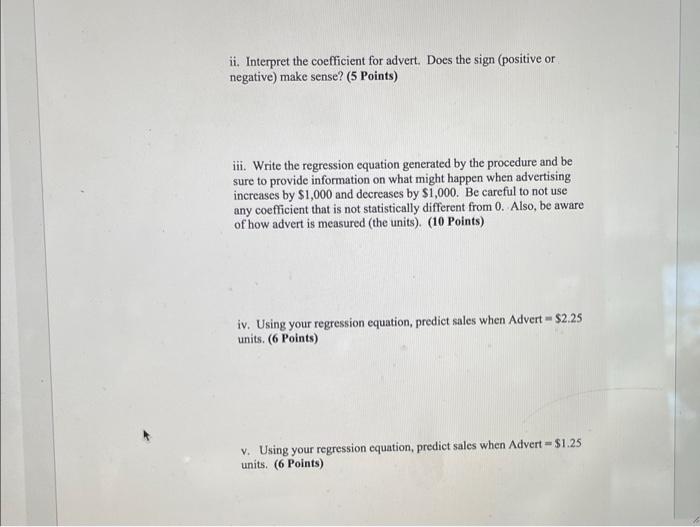
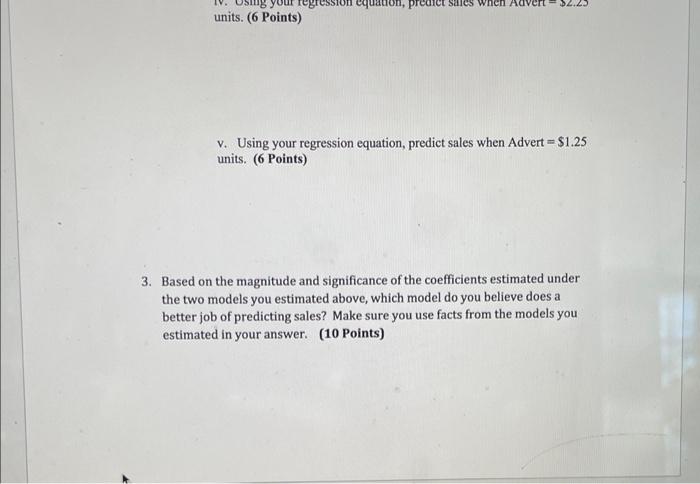
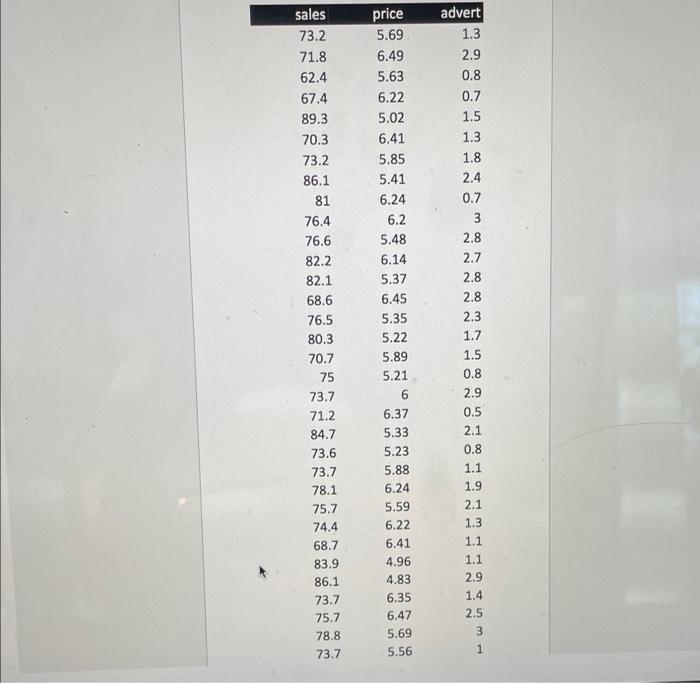
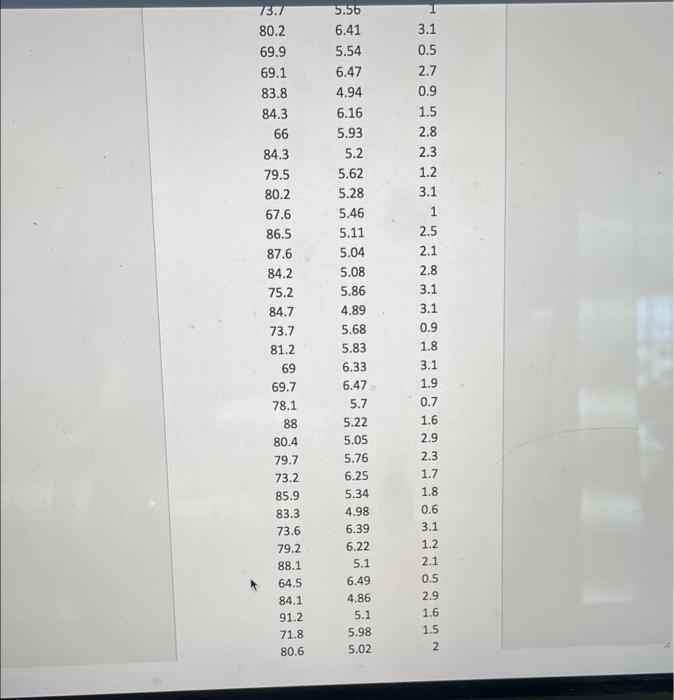
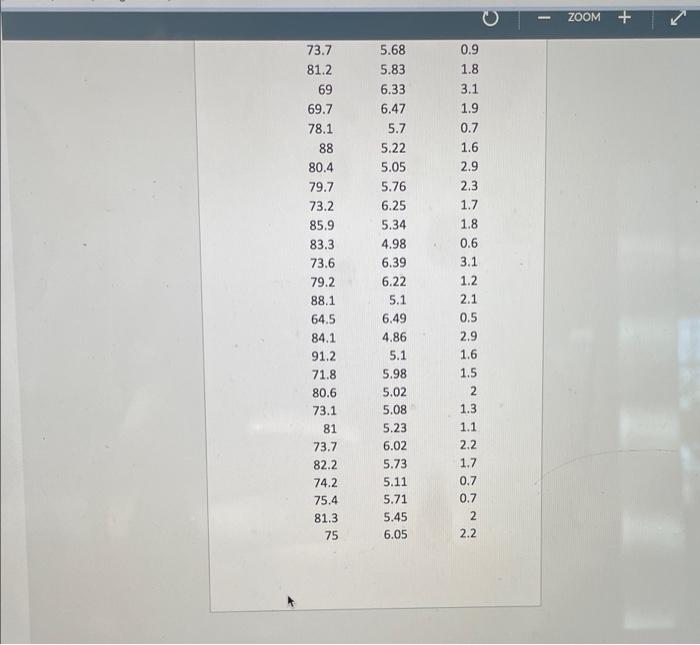
AGEC 440 Homework #2 100 Points Available This Homework Will Use the Homework 2 Excel Data Sheet (Data Tab) Please carry any decimals out two places if numbers are involved in your answer. Please print your output and bring to class on the due date. 1. Suppose you have been asked to analyze your agribusiness company's sales data. You have been provided weekly sales (in thousands of dollars), the price of the product (in $/unit) and weekly advertising expenditures (in thousands of dollars). (a) Compute the Descriptive Summary Statistics using the option under Excel's Data Analysis. (10 Points) (b) Run a simple linear regression using Sales as the dependent variable and Price as the independent variable. You will use the output from this procedure to answer the remaining questions. 1. Evaluate the F-test for the regression. Use an alpha (or level of significance) of 0.10 to assess whether the Mean Squares (MS) are statistically different between the Regression and the Residuals. Is the F-test metric significant? (5 Points) ii. Comment on the significance of the coefficients estimated from the ii. Comment on the significance of the coefficients estimated from the regression. Recall the null hypothesis in the individual coefficient t- test of 3 - and the alternative hypothesis B not equal to 0. Use an alpha (or level of significance) of 0.10. (8 Points) iii. Interpret the coefficient for price. Does the sign (positive or negative) make sense? (5 Points) iv. Write the regression equation generated by the procedure and be sure to provide information on what might happen when price increases and decreases by $1. Be careful to not use any coefficient that is not statistically different from 0. (10 Points) v. Using your regression equation, predict sales when Price = $10.6 Points) vi. Using your regression equation, predict sales when Price = $3. (6 Points) 2. Run a simple linear regression using Sales as the dependent variable and Advertising (advert) as the independent variable. You will use the output from this procedure to answer the remaining questions. a. Evaluate the F-test for the regression. Use an alpha (or level of significance) of 0.10 to assess whether the Mean Squares (MS) are statistically different between the Regression and the Residuals. Is the F-test metric significant? (5 Points) i. Comment on the significance of the coefficients estimated from the regression. Recall the null hypothesis in the individual coefficient t- test of B = 0 and the alternative hypothesis B not equal to 0. Use an alpha (or level of significance) of 0.10. (8 Points) ii. Interpret the coefficient for advert. Does the sign (positive or negative) make sense? (5 Points) iii. Write the regression equation generated by the procedure and be sure to provide information on what might happen when advertising increases by $1,000 and decreases by $1,000. Be careful to not use any coefficient that is not statistically different from 0. Also, be aware of how advert is measured (the units). (10 Points) iv. Using your regression equation, predict sales when Advert - $2.25 units. (6 Points) v. Using your regression equation, predict sales when Advert - $1.25 units. (6 Points) 2.23 8 your regression equation, predict Sales when Advert units. (6 Points) v. Using your regression equation, predict sales when Advert - $1.25 units. (6 Points) 3. Based on the magnitude and significance of the coefficients estimated under the two models you estimated above, which model do you believe does a better job of predicting sales? Make sure you use facts from the models you estimated in your answer. (10 Points) sales 73.2 71.8 62.4 67.4 89.3 70.3 73.2 86.1 81 76.4 76.6 82.2 82.1 68.6 76.5 80.3 70.7 75 73.7 71.2 84.7 73.6 73.7 78.1 75.7 74.4 68.7 83.9 86.1 73.7 75.7 78.8 73.7 price 5.69 6.49 5.63 6.22 5.02 6.41 5.85 5.41 6.24 6.2 5.48 6.14 5.37 6.45 5.35 5.22 5.89 5.21 6 6.37 5.33 5.23 5.88 6.24 5.59 6.22 6.41 4.96 4.83 6.35 6.47 5.69 5.56 advert 1.3 2.9 0.8 0.7 1.5 1.3 1.8 2.4 0.7 3 2.8 2.7 2.8 2.8 2.3 1.7 1.5 0.8 2.9 0.5 2.1 0.8 1.1 1.9 2.1 1.3 1.1 1.1 2.9 1.4 2.5 3 1 3.1 0.5 2.7 0.9 1.5 2.8 2.3 1.2 75.7 80.2 69.9 69.1 83.8 84.3 66 84.3 79.5 80.2 67.6 86.5 87.6 84.2 75.2 84.7 73.7 81.2 69 69.7 78.1 88 80.4 79.7 73.2 85.9 83.3 73.6 79.2 88.1 64.5 84.1 91.2 71.8 80.6 5.56 6.41 5.54 6.47 4.94 6.16 5.93 5.2 5.62 5.28 5.46 5.11 5.04 5.08 5.86 4.89 5.68 5.83 6.33 6.47 5.7 5.22 5.05 5.76 6.25 5.34 4.98 6.39 6.22 5.1 6.49 4.86 5.1 5.98 5.02 3.1 1 2.5 2.1 2.8 3.1 3.1 0.9 1.8 3.1 1.9 0.7 1.6 2.9 2.3 1.7 1.8 0.6 3.1 1.2 2.1 0.5 2.9 1.6 1.5 2 ZOOM + 73.7 81.2 69 69.7 78.1 88 80.4 79.7 73.2 85.9 83.3 73.6 79.2 88.1 64.5 84.1 91.2 71.8 80.6 73.1 81 73.7 82.2 74.2 75.4 81.3 75 5.68 5.83 6.33 6.47 5.7 5.22 5.05 5.76 6.25 5.34 4.98 6.39 6.22 5.1 6.49 4.86 5.1 5.98 5.02 5.08 5.23 6.02 5.73 5.11 5.71 5.45 6.05 0.9 1.8 3.1 1.9 0.7 1.6 2.9 2.3 1.7 1.8 0.6 3.1 1.2 2.1 0.5 2.9 1.6 1.5 2 1.3 1.1 2.2 1.7 0.7 0.7 2 2.2 AGEC 440 Homework #2 100 Points Available This Homework Will Use the Homework 2 Excel Data Sheet (Data Tab) Please carry any decimals out two places if numbers are involved in your answer. Please print your output and bring to class on the due date. 1. Suppose you have been asked to analyze your agribusiness company's sales data. You have been provided weekly sales (in thousands of dollars), the price of the product (in $/unit) and weekly advertising expenditures (in thousands of dollars). (a) Compute the Descriptive Summary Statistics using the option under Excel's Data Analysis. (10 Points) (b) Run a simple linear regression using Sales as the dependent variable and Price as the independent variable. You will use the output from this procedure to answer the remaining questions. 1. Evaluate the F-test for the regression. Use an alpha (or level of significance) of 0.10 to assess whether the Mean Squares (MS) are statistically different between the Regression and the Residuals. Is the F-test metric significant? (5 Points) ii. Comment on the significance of the coefficients estimated from the ii. Comment on the significance of the coefficients estimated from the regression. Recall the null hypothesis in the individual coefficient t- test of 3 - and the alternative hypothesis B not equal to 0. Use an alpha (or level of significance) of 0.10. (8 Points) iii. Interpret the coefficient for price. Does the sign (positive or negative) make sense? (5 Points) iv. Write the regression equation generated by the procedure and be sure to provide information on what might happen when price increases and decreases by $1. Be careful to not use any coefficient that is not statistically different from 0. (10 Points) v. Using your regression equation, predict sales when Price = $10.6 Points) vi. Using your regression equation, predict sales when Price = $3. (6 Points) 2. Run a simple linear regression using Sales as the dependent variable and Advertising (advert) as the independent variable. You will use the output from this procedure to answer the remaining questions. a. Evaluate the F-test for the regression. Use an alpha (or level of significance) of 0.10 to assess whether the Mean Squares (MS) are statistically different between the Regression and the Residuals. Is the F-test metric significant? (5 Points) i. Comment on the significance of the coefficients estimated from the regression. Recall the null hypothesis in the individual coefficient t- test of B = 0 and the alternative hypothesis B not equal to 0. Use an alpha (or level of significance) of 0.10. (8 Points) ii. Interpret the coefficient for advert. Does the sign (positive or negative) make sense? (5 Points) iii. Write the regression equation generated by the procedure and be sure to provide information on what might happen when advertising increases by $1,000 and decreases by $1,000. Be careful to not use any coefficient that is not statistically different from 0. Also, be aware of how advert is measured (the units). (10 Points) iv. Using your regression equation, predict sales when Advert - $2.25 units. (6 Points) v. Using your regression equation, predict sales when Advert - $1.25 units. (6 Points) 2.23 8 your regression equation, predict Sales when Advert units. (6 Points) v. Using your regression equation, predict sales when Advert - $1.25 units. (6 Points) 3. Based on the magnitude and significance of the coefficients estimated under the two models you estimated above, which model do you believe does a better job of predicting sales? Make sure you use facts from the models you estimated in your answer. (10 Points) sales 73.2 71.8 62.4 67.4 89.3 70.3 73.2 86.1 81 76.4 76.6 82.2 82.1 68.6 76.5 80.3 70.7 75 73.7 71.2 84.7 73.6 73.7 78.1 75.7 74.4 68.7 83.9 86.1 73.7 75.7 78.8 73.7 price 5.69 6.49 5.63 6.22 5.02 6.41 5.85 5.41 6.24 6.2 5.48 6.14 5.37 6.45 5.35 5.22 5.89 5.21 6 6.37 5.33 5.23 5.88 6.24 5.59 6.22 6.41 4.96 4.83 6.35 6.47 5.69 5.56 advert 1.3 2.9 0.8 0.7 1.5 1.3 1.8 2.4 0.7 3 2.8 2.7 2.8 2.8 2.3 1.7 1.5 0.8 2.9 0.5 2.1 0.8 1.1 1.9 2.1 1.3 1.1 1.1 2.9 1.4 2.5 3 1 3.1 0.5 2.7 0.9 1.5 2.8 2.3 1.2 75.7 80.2 69.9 69.1 83.8 84.3 66 84.3 79.5 80.2 67.6 86.5 87.6 84.2 75.2 84.7 73.7 81.2 69 69.7 78.1 88 80.4 79.7 73.2 85.9 83.3 73.6 79.2 88.1 64.5 84.1 91.2 71.8 80.6 5.56 6.41 5.54 6.47 4.94 6.16 5.93 5.2 5.62 5.28 5.46 5.11 5.04 5.08 5.86 4.89 5.68 5.83 6.33 6.47 5.7 5.22 5.05 5.76 6.25 5.34 4.98 6.39 6.22 5.1 6.49 4.86 5.1 5.98 5.02 3.1 1 2.5 2.1 2.8 3.1 3.1 0.9 1.8 3.1 1.9 0.7 1.6 2.9 2.3 1.7 1.8 0.6 3.1 1.2 2.1 0.5 2.9 1.6 1.5 2 ZOOM + 73.7 81.2 69 69.7 78.1 88 80.4 79.7 73.2 85.9 83.3 73.6 79.2 88.1 64.5 84.1 91.2 71.8 80.6 73.1 81 73.7 82.2 74.2 75.4 81.3 75 5.68 5.83 6.33 6.47 5.7 5.22 5.05 5.76 6.25 5.34 4.98 6.39 6.22 5.1 6.49 4.86 5.1 5.98 5.02 5.08 5.23 6.02 5.73 5.11 5.71 5.45 6.05 0.9 1.8 3.1 1.9 0.7 1.6 2.9 2.3 1.7 1.8 0.6 3.1 1.2 2.1 0.5 2.9 1.6 1.5 2 1.3 1.1 2.2 1.7 0.7 0.7 2 2.2
Step by Step Solution
There are 3 Steps involved in it

Get step-by-step solutions from verified subject matter experts