

Question: AI D K L M N A B E F H J Your team at work has identified two possible projects that could be undertaken
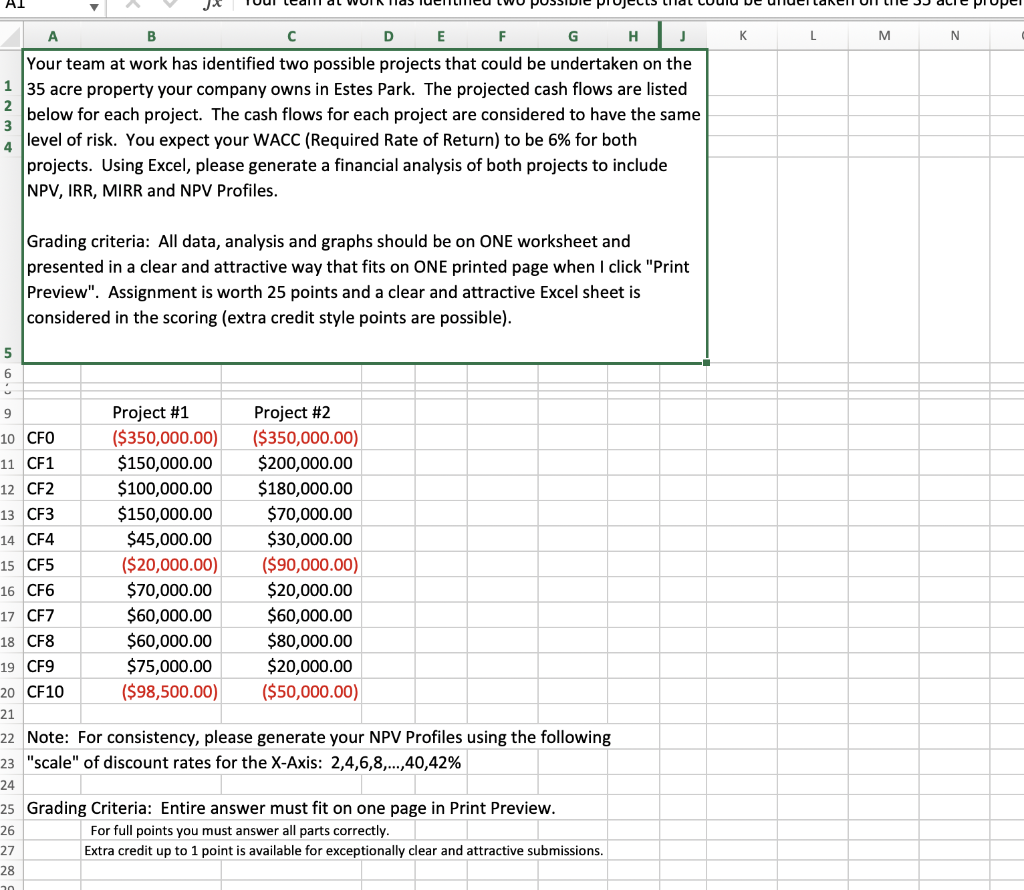
AI D K L M N A B E F H J Your team at work has identified two possible projects that could be undertaken on the 1 35 acre property your company owns in Estes Park. The projected cash flows are listed below for each project. The cash flows for each project are considered to have the same level of risk. You expect your WACC (Required Rate of Return) to be 6% for both projects. Using Excel, please generate a financial analysis of both projects to include NPV, IRR, MIRR and NPV Profiles. 4 Grading criteria: All data, analysis and graphs should be on ONE worksheet and presented in a clear and attractive way that fits on ONE printed page when I click "Print Preview". Assignment is worth 25 points and a clear and attractive Excel sheet is considered in the scoring (extra credit style points are possible). 5 6 9 Project #1 Project #2 10 CFO ($350,000.00) ($350,000.00) 11 CF1 $150,000.00 $200,000.00 12 CF2 $100,000.00 $180,000.00 13 CF3 $150,000.00 $70,000.00 14 CF4 $45,000.00 $30,000.00 15 CF5 ($20,000.00) ($90,000.00) 16 CF6 $70,000.00 $20,000.00 17 CF7 $60,000.00 $60,000.00 18 CF8 $60,000.00 $80,000.00 19 CF9 $75,000.00 $20,000.00 20 CF10 ($98,500.00) ($50,000.00) 21 22 Note: For consistency, please generate your NPV Profiles using the following 23 "scale" of discount rates for the X-Axis: 2,4,6,8,...,40,42% 24 25 Grading Criteria: Entire answer must fit on one page in Print Preview. 26 For full points you must answer all parts correctly. 27 Extra credit up to 1 point is available for exceptionally clear and attractive submissions. 28 20 AI D K L M N A B E F H J Your team at work has identified two possible projects that could be undertaken on the 1 35 acre property your company owns in Estes Park. The projected cash flows are listed below for each project. The cash flows for each project are considered to have the same level of risk. You expect your WACC (Required Rate of Return) to be 6% for both projects. Using Excel, please generate a financial analysis of both projects to include NPV, IRR, MIRR and NPV Profiles. 4 Grading criteria: All data, analysis and graphs should be on ONE worksheet and presented in a clear and attractive way that fits on ONE printed page when I click "Print Preview". Assignment is worth 25 points and a clear and attractive Excel sheet is considered in the scoring (extra credit style points are possible). 5 6 9 Project #1 Project #2 10 CFO ($350,000.00) ($350,000.00) 11 CF1 $150,000.00 $200,000.00 12 CF2 $100,000.00 $180,000.00 13 CF3 $150,000.00 $70,000.00 14 CF4 $45,000.00 $30,000.00 15 CF5 ($20,000.00) ($90,000.00) 16 CF6 $70,000.00 $20,000.00 17 CF7 $60,000.00 $60,000.00 18 CF8 $60,000.00 $80,000.00 19 CF9 $75,000.00 $20,000.00 20 CF10 ($98,500.00) ($50,000.00) 21 22 Note: For consistency, please generate your NPV Profiles using the following 23 "scale" of discount rates for the X-Axis: 2,4,6,8,...,40,42% 24 25 Grading Criteria: Entire answer must fit on one page in Print Preview. 26 For full points you must answer all parts correctly. 27 Extra credit up to 1 point is available for exceptionally clear and attractive submissions. 28 20
Step by Step Solution
There are 3 Steps involved in it

Get step-by-step solutions from verified subject matter experts