

Question: All info for the chart is given in the 2nd picture. Answers for the chart are free-response. Answers for the question on the side are
 All info for the chart is given in the 2nd picture. Answers for the chart are free-response. Answers for the question on the side are given. If correct, I will make sure to thumbs up, thank you!
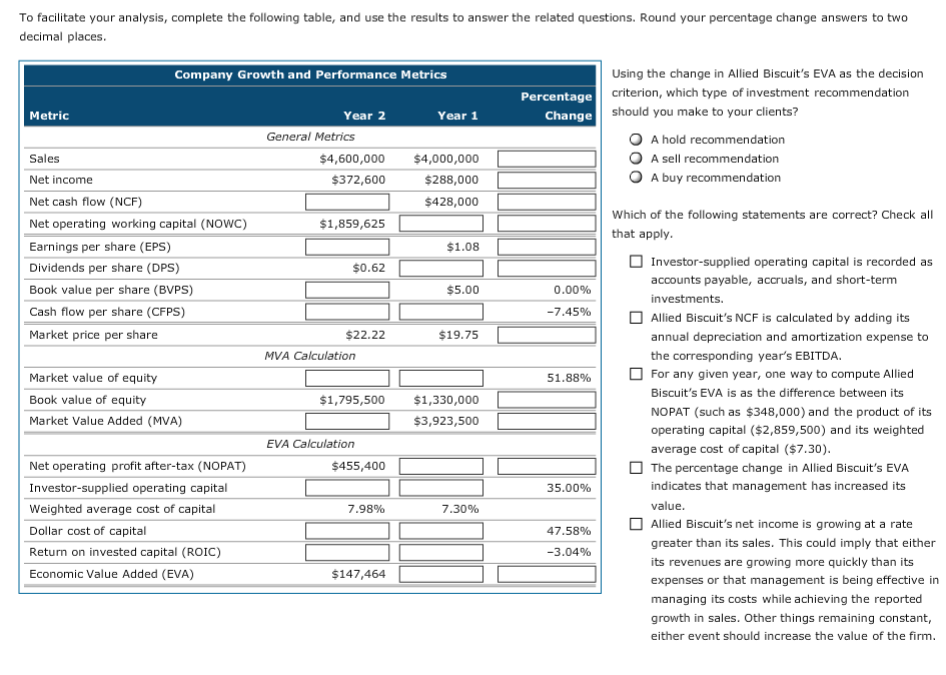
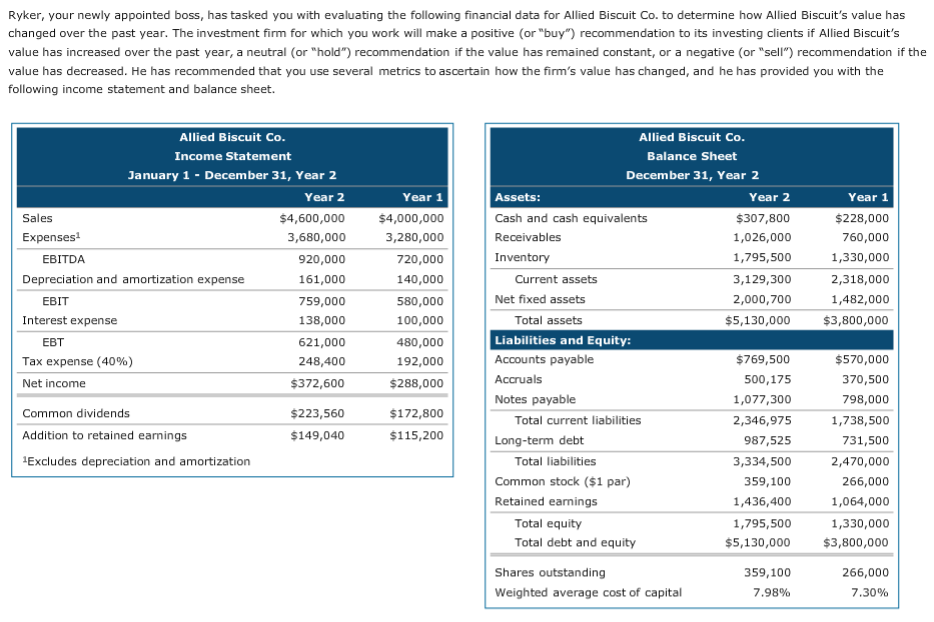
To facilitate your analysis, complete the following table, and use the results to answer the related questions. Round your percentage change answers to two decimal places Using the change in Allied Biscuit's EVA as the decision criterion, which type of investment recommendation should you make to your clients? Company Growth and Performance Metrics Percentage Change Metric Year 2 Year 1 General Metrics A hold recommendation A sell recommendation O A buy recommendation Sales Net income Net cash flow (NCF) Net operating working capital (NOWC) Earnings per share (EPS) Dividends per share (DPS) Book value per share (BVPS) Cash flow per share (CFPS) Market price per share $4,600,000 $4,000,000 $288,000 $428,000 $372,600 Which of the following statements are correct? Check all that apply $1,859,625 $1.08 Investor-supplied operating capital is recorded as $0.62 accounts payable, accruals, and short-term investments. Allied Biscuit's NCF is calculated by adding its annual depreciation and amortization expense to the corresponding year's EBITDA For any given year, one way to compute Allied Biscuit's EVA is as the difference between its NOPAT (such as $348,000) and the product of its operating capital ($2,859,500) and its weighted average cost of capital ($7.30) $5.00 0.00% -7.45% $22.22 $19.75 MVA Calculation Market value of equity Book value of equity Market Value Added (MVA) 51.8896 $1,795,500 $1,330,000 $3,923,500 EVA Calculation Net operating profit after-tax (NOPAT) Investor-supplied operating capital Weighted average cost of capital Dollar cost of capital Return on invested capital (ROIC) Economic Value Added (EVA) $455,400 The percentage change in Allied Biscuit's EVA indicates that management has increased its value Allied Biscuit's net income is growing at a rate greater than its sales. This could imply that either its revenues are growing more quickly than its expenses or that management is being effective in managing its costs while achieving the reported growth in sales. Other things remaining constant, either event should increase the value of the firm 35.00% 7.98% 7.30% 47.58% -3.04% 147,464 Ryker, your newly appointed boss, has tasked you with evaluating the following financial data for Allied Biscuit Co. to determine how Allied Biscuit's value has changed over the past year. The investment firm for which you work will make a positive (or "buy") recommendation to its investing clients if Allied Biscuit's value has increased over the past year, a neutral (or "hold") recommendation if the value has remained constant, or a negative (or "sell") recommendation if the value has decreased. He has recommended that you use several metrics to ascertain how the firm's value has changed, and he has provided you with the following income statement and balance sheet. Allied Biscuit Co. Income Statement January 1 - December 31, Year 2 Allied Biscuit Co. Balance Sheet December 31, Year 2 Year 2 $4,600,000 3,680,000 920,000 161,000 759,000 138,000 621,000 248,400 $372,600 Year 1 $4,000,000 3,280,000 720,000 140,000 580,000 100,000 480,000 192,000 $288,000 Assets: Cash and cash equivalents Receivables Year 2 $307,800 1,026,000 1,795,500 3,129,300 2,000,700 $5,130,000 Year 1 $228,000 760,000 1,330,000 2,318,000 1,482,000 $3,800,000 es Expenses1 EBITDA Depreciation and amortization expense Current assets EBIT Net fixed assets Interest expense Total assets EBT Liabilities and Equity: payable $769,500 500,175 1,077,300 2,346,975 987,525 3,334,500 359,100 1,436,400 1,795,500 $5,130,000 359,100 7.98% $570,000 370,500 798,000 1,738,500 731,500 2,470,000 266,000 1,064,000 1,330,000 $3,800,000 266,000 7.30% Tax expense (40%) Net income Common dividends Addition to retained earnings Excludes depreciation and amortization Accrua Notes payable $223,560 149,040 $172,800 Total current liabilities $115,200 Long-term debt Total liabilities Common stock ($1 par) Retained earnings Total equity Total debt and equity Shares outstanding Weighted average cost of capital To facilitate your analysis, complete the following table, and use the results to answer the related questions. Round your percentage change answers to two decimal places Using the change in Allied Biscuit's EVA as the decision criterion, which type of investment recommendation should you make to your clients? Company Growth and Performance Metrics Percentage Change Metric Year 2 Year 1 General Metrics A hold recommendation A sell recommendation O A buy recommendation Sales Net income Net cash flow (NCF) Net operating working capital (NOWC) Earnings per share (EPS) Dividends per share (DPS) Book value per share (BVPS) Cash flow per share (CFPS) Market price per share $4,600,000 $4,000,000 $288,000 $428,000 $372,600 Which of the following statements are correct? Check all that apply $1,859,625 $1.08 Investor-supplied operating capital is recorded as $0.62 accounts payable, accruals, and short-term investments. Allied Biscuit's NCF is calculated by adding its annual depreciation and amortization expense to the corresponding year's EBITDA For any given year, one way to compute Allied Biscuit's EVA is as the difference between its NOPAT (such as $348,000) and the product of its operating capital ($2,859,500) and its weighted average cost of capital ($7.30) $5.00 0.00% -7.45% $22.22 $19.75 MVA Calculation Market value of equity Book value of equity Market Value Added (MVA) 51.8896 $1,795,500 $1,330,000 $3,923,500 EVA Calculation Net operating profit after-tax (NOPAT) Investor-supplied operating capital Weighted average cost of capital Dollar cost of capital Return on invested capital (ROIC) Economic Value Added (EVA) $455,400 The percentage change in Allied Biscuit's EVA indicates that management has increased its value Allied Biscuit's net income is growing at a rate greater than its sales. This could imply that either its revenues are growing more quickly than its expenses or that management is being effective in managing its costs while achieving the reported growth in sales. Other things remaining constant, either event should increase the value of the firm 35.00% 7.98% 7.30% 47.58% -3.04% 147,464 Ryker, your newly appointed boss, has tasked you with evaluating the following financial data for Allied Biscuit Co. to determine how Allied Biscuit's value has changed over the past year. The investment firm for which you work will make a positive (or "buy") recommendation to its investing clients if Allied Biscuit's value has increased over the past year, a neutral (or "hold") recommendation if the value has remained constant, or a negative (or "sell") recommendation if the value has decreased. He has recommended that you use several metrics to ascertain how the firm's value has changed, and he has provided you with the following income statement and balance sheet. Allied Biscuit Co. Income Statement January 1 - December 31, Year 2 Allied Biscuit Co. Balance Sheet December 31, Year 2 Year 2 $4,600,000 3,680,000 920,000 161,000 759,000 138,000 621,000 248,400 $372,600 Year 1 $4,000,000 3,280,000 720,000 140,000 580,000 100,000 480,000 192,000 $288,000 Assets: Cash and cash equivalents Receivables Year 2 $307,800 1,026,000 1,795,500 3,129,300 2,000,700 $5,130,000 Year 1 $228,000 760,000 1,330,000 2,318,000 1,482,000 $3,800,000 es Expenses1 EBITDA Depreciation and amortization expense Current assets EBIT Net fixed assets Interest expense Total assets EBT Liabilities and Equity: payable $769,500 500,175 1,077,300 2,346,975 987,525 3,334,500 359,100 1,436,400 1,795,500 $5,130,000 359,100 7.98% $570,000 370,500 798,000 1,738,500 731,500 2,470,000 266,000 1,064,000 1,330,000 $3,800,000 266,000 7.30% Tax expense (40%) Net income Common dividends Addition to retained earnings Excludes depreciation and amortization Accrua Notes payable $223,560 149,040 $172,800 Total current liabilities $115,200 Long-term debt Total liabilities Common stock ($1 par) Retained earnings Total equity Total debt and equity Shares outstanding Weighted average cost of capital
Step by Step Solution
There are 3 Steps involved in it

Get step-by-step solutions from verified subject matter experts