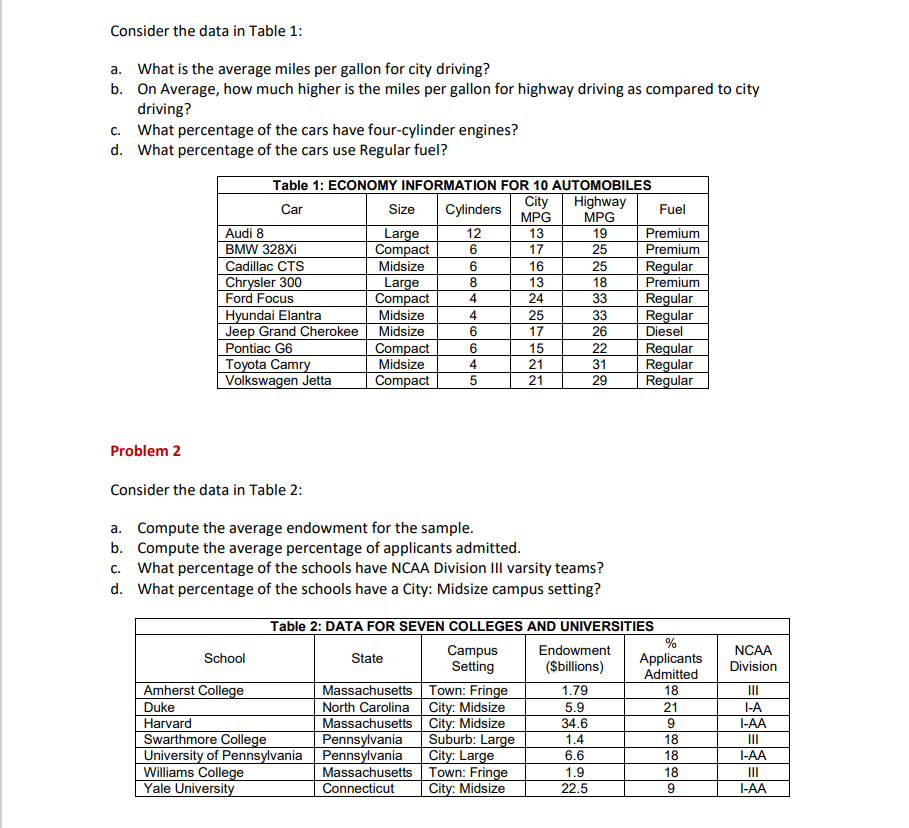
Question: (all problems in one MS Word file plus your Excel file ( with formulas shown) Consider the data in Table 1: a. What is the

(all problems in one MS Word file plus your Excel file ( with formulas shown)

(all problems in one MS Word file plus your Excel

(all problems in one MS Word file plus your Excel

Consider the data in Table 1: a. What is the average miles per gallon for city driving? b. On Average, how much higher is the miles per gallon for highway driving as compared to city driving? c. What percentage of the cars have four-cylinder engines? d. What percentage of the cars use Regular fuel? Table 1: ECONOMY INFORMATION FOR 10 AUTOMOBILES Car Cylinders City MPG Size Large Highway MPG Fuel 12 13 19 Premium Compact 6 17 25 Premium Audi 8 BMW 328xi Cadillac CTS Chrysler 300 Ford Focus 6 16 25 Regular Midsize Large 8 13 18 Premium Compact 4 24 33 Regular Hyundai Elantra Midsize 4 25 33 Regular Midsize 6 17 26 Diesel Jeep Grand Cherokee Pontiac G6 6 15 22 Compact Midsize Regular 21 31 Regular Toyota Camry Volkswagen Jetta Compact 5 21 29 Regular Problem 2 Consider the data in Table 2: a. Compute the average endowment for the sample. b. Compute the average percentage of applicants admitted. c. What percentage of the schools have NCAA Division III varsity teams? d. What percentage of the schools have a City: Midsize campus setting? School Amherst College Duke Harvard Swarthmore College University of Pennsylvania Williams College Yale University 4 Table 2: DATA FOR SEVEN COLLEGES AND UNIVERSITIES % State Campus Setting Endowment ($billions) Applicants Admitted Town: Fringe 1.79 18 Massachusetts North Carolina 5.9 21 City: Midsize City: Midsize Massachusetts 34.6 9 Suburb: Large 1.4 18 6.6 18 Pennsylvania Pennsylvania City: Large Massachusetts Town: Fringe Connecticut 1.9 18 City: Midsize 22.5 9 NCAA Division III I-A I-AA III I-AA I-AA State whether each of the following variables is categorical or quantitative and state its measurement scale. a. Annual sales: b. Soft drink size (small, medium, large): c. Employee classifications (GS1 through GS18): d. Earnings per share e. Method of payment (cash, check, credit card) Problem 4 The Food and Drug Administration (FDA) reported the number of new drugs approved over an eight- year period (The Wall Street Journal, January 12, 2014). Figure 4 provides a bar chart Summarizing the number of new drugs approved each year. a. Are the data categorical or quantitative? b. Are the data time series or cross-sectional? c. How many new drugs were approved in 2003? d. In what year were the fewest new drugs approved? How many? e. Comment on the trend in the number of new drugs approved by the FDA over the eight-year period. Figure 4: Number of New Drugs Approved by the Food and Drug Administration 1996 1997 1998 1999 2000 2001 2002 2003 Year 55 Number of New Drugs 30 15 0

Step by Step Solution

There are 3 Steps involved in it

1 Expert Approved Answer
Step: 1 Unlock blur-text-image
Question Has Been Solved by an Expert!

Get step-by-step solutions from verified subject matter experts

Step: 2 Unlock
Step: 3 Unlock

Students Have Also Explored These Related General Management Questions!