

Question: (a)ls the temperature vs time plot on the graph linear? Should it be? Explain? 72.1 Trend IN DESC 20 (b)Why were 40C and 70C chosen
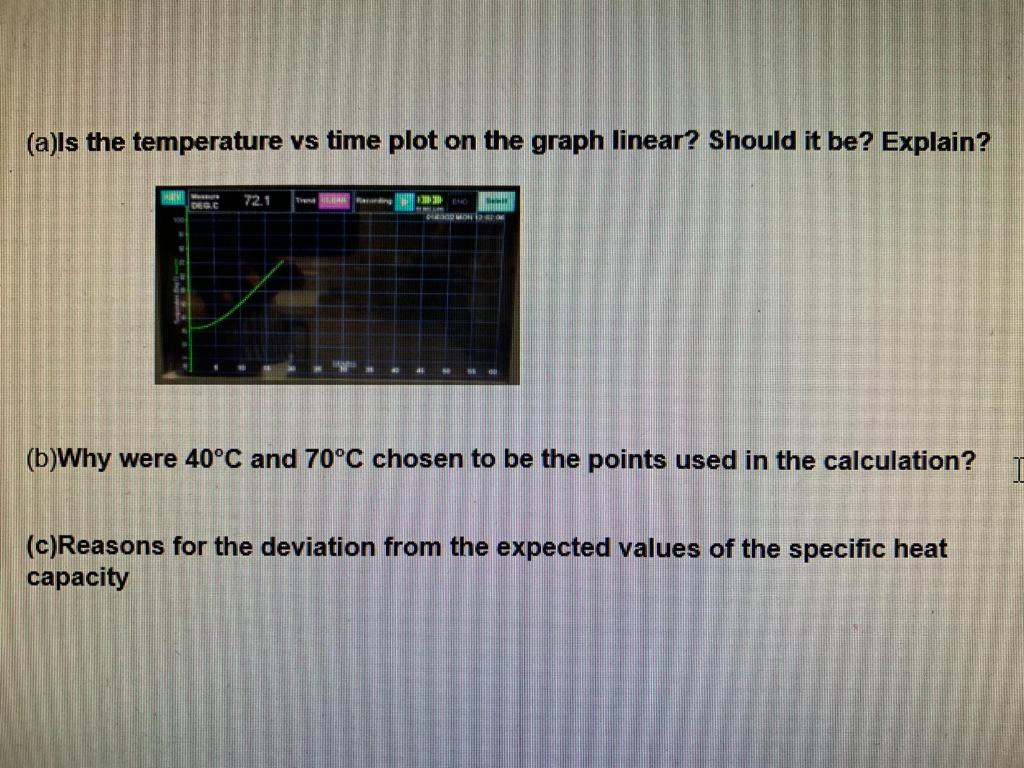
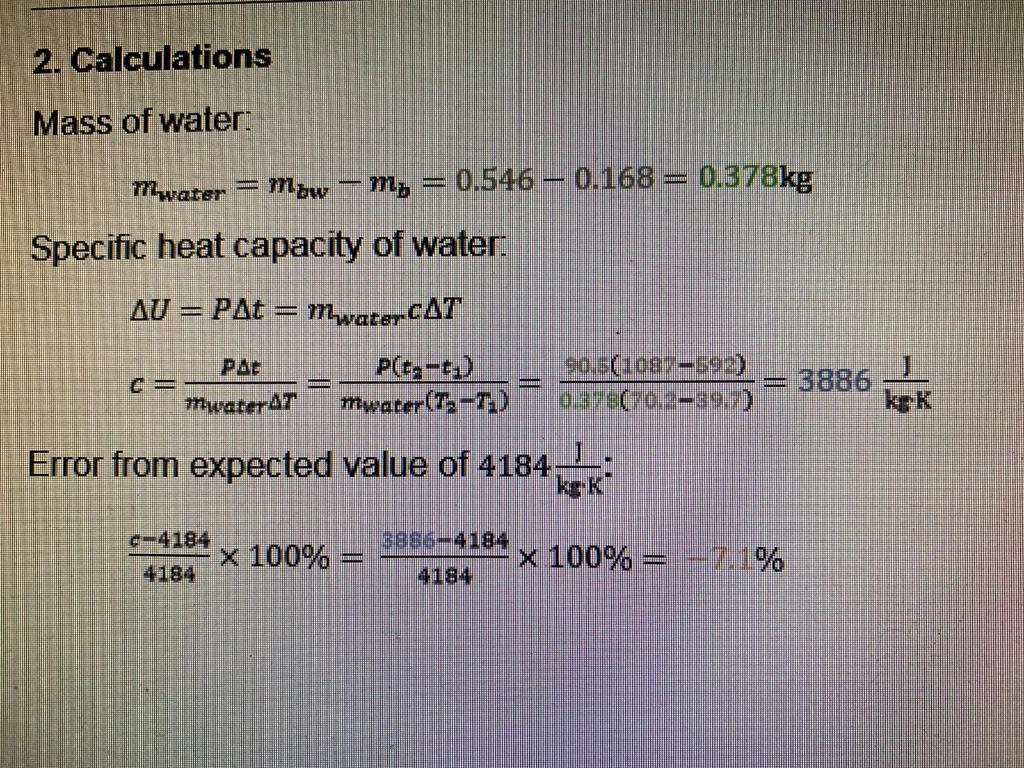
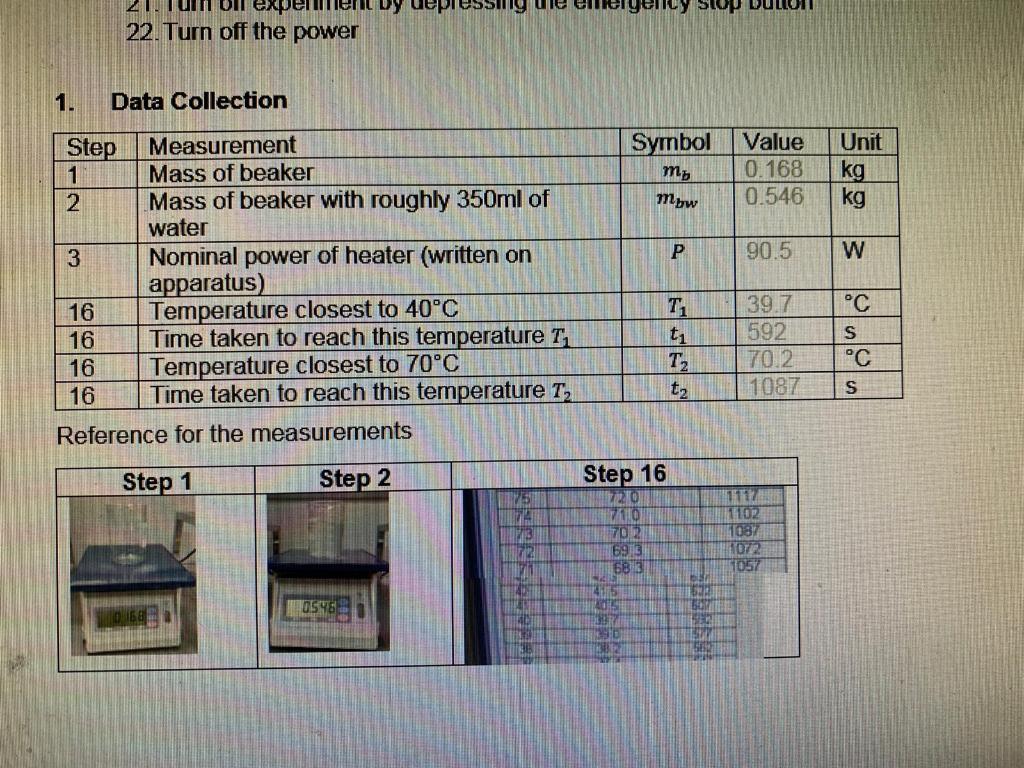
(a)ls the temperature vs time plot on the graph linear? Should it be? Explain? 72.1 Trend IN DESC 20 (b)Why were 40C and 70C chosen to be the points used in the calculation? (c)Reasons for the deviation from the expected values of the specific heat capacity 2. Calculations Mass of water: m vater = maw my = 0.546 0.168 = 0.378kg Specific heat capacity of water. AU = PAt = mwaterCAT PAC P(ta-t1) mwater(T.-T.) 90.5(1087-592) 0378070.239.7) mwater AT 3886 kgK Error from expected value of 4184 kek e-4184 x 100% 3886-4184 x 100% = -7.1% 4184 Essig ue em yelley SOP DULUI 2. TUOL itoy ae 22. Turn off the power 1. Data Collection Symbol Mbw Value 0.168 0.546 Unit kg kg P 90.5 W Step Measurement 1 Mass of beaker 2 Mass of beaker with roughly 350ml of water 3 Nominal power of heater (written on apparatus) 16 Temperature closest to 40C 16 Time taken to reach this temperature T 16 Temperature closest to 70C 16 Time taken to reach this temperature T2 Reference for the measurements C T ti T2 t2 39.7 592 70.2 1087 s C s Step 1 Step 2 Step 16 TO 70 WS 12 73 72 1717 1102 1087 703 1072 696 1683 1057 4 USY 2013 607 TRI 90 150
Step by Step Solution
There are 3 Steps involved in it

Get step-by-step solutions from verified subject matter experts