

Question: ALSO ASKS FOR THESE: The mean square error for method 1 is _______ thousand gallons square. The mean absolute deviation for method 2 is _______
ALSO ASKS FOR THESE:
The mean square error for method 1 is _______ thousand gallons square.
The mean absolute deviation for method 2 is _______ thousand gallons.
The mean square error for method 2 is ______ thousand gallons square.
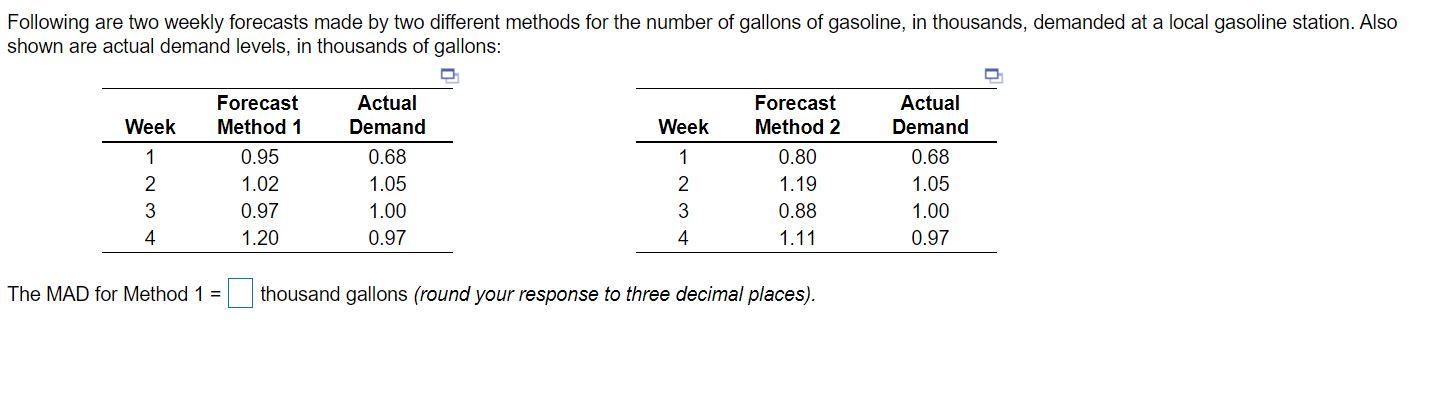
Following are two weekly forecasts made by two different methods for the number of gallons of gasoline, in thousands, demanded at a local gasoline station. Also shown are actual demand levels, in thousands of gallons: Week Week 1 2 3 4 Forecast Method 1 0.95 1.02 0.97 1.20 Actual Demand 0.68 1.05 1.00 0.97 1 2 3 4 Forecast Method 2 0.80 1.19 0.88 1.11 Actual Demand 0.68 1.05 1.00 0.97 The MAD for Method 1 = thousand gallons (round your response to three decimal places)Step by Step Solution
There are 3 Steps involved in it
1 Expert Approved Answer
Step: 1 Unlock

Question Has Been Solved by an Expert!
Get step-by-step solutions from verified subject matter experts
Step: 2 Unlock
Step: 3 Unlock