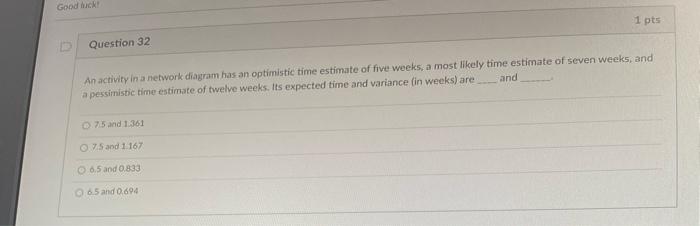
Question: An activity in a network diagram has an optimistic time estimate of five weeks, a most likely time estimate of seven weeks, and a pessimistic

An activity in a network diagram has an
An activity in a network diagram has an optimistic time estimate of five weeks, a most likely time estimate of seven weeks, and a pessimistic time estimate of twelve weeks. Its expected time ard variance (in weeks) are and 75 and 1:361 7.5 and 1.167 6.5 and 0.833 65 and 0.698

Step by Step Solution

There are 3 Steps involved in it

1 Expert Approved Answer
Step: 1 Unlock blur-text-image
Question Has Been Solved by an Expert!

Get step-by-step solutions from verified subject matter experts

Step: 2 Unlock
Step: 3 Unlock

Students Have Also Explored These Related General Management Questions!