

An airline developed a regression model to predict revenue from flights that connect feeder cities to...
Fantastic news! We've Found the answer you've been seeking!
Question:

Transcribed Image Text:
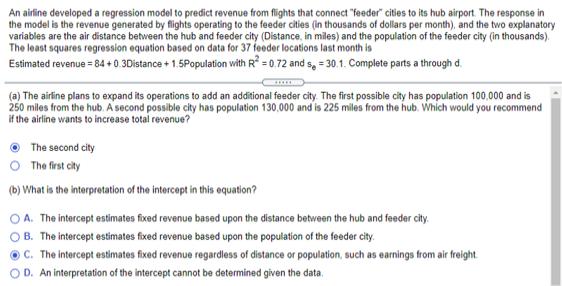
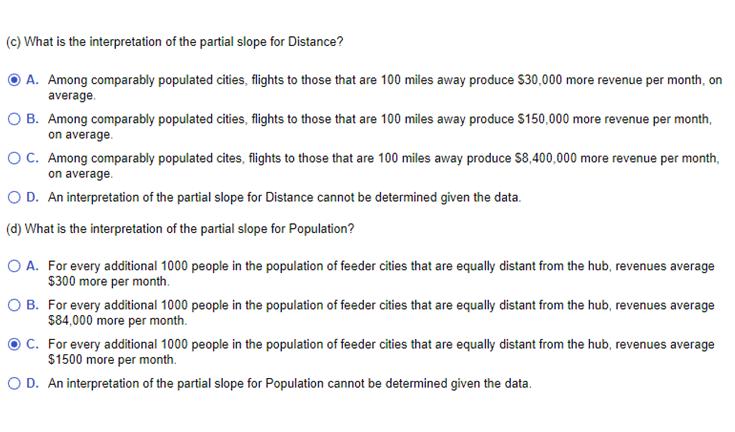
An airline developed a regression model to predict revenue from flights that connect "feeder cities to its hub airport. The response in the model is the revenue generated by flights operating to the feeder cities (in thousands of dollars per month), and the two explanatory variables are the air distance between the hub and feeder city (Distance, in miles) and the population of the feeder city (in thousands). The least squares regression equation based on data for 37 feeder locations last month is Estimated revenue = 84 +0.3Distance +1.5Population with R² = 0.72 and s, 30.1. Complete parts a through d. (a) The airline plans to expand its operations to add an additional feeder city. The first possible city has population 100,000 and is 250 miles from the hub. A second possible city has population 130.000 and is 225 miles from the hub. Which would you recommend if the airline wants to increase total revenue? The second city O The first city (b) What is the interpretation of the intercept in this equation? OA. The intercept estimates fixed revenue based upon the distance between the hub and feeder city. B. The intercept estimates fixed revenue based upon the population of the feeder city. C. The intercept estimates fixed revenue regardless of distance or population, such as earnings from air freight D. An interpretation of the intercept cannot be determined given the data. (c) What is the interpretation of the partial slope for Distance? A. Among comparably populated cities, flights to those that are 100 miles away produce $30,000 more revenue per month, on average. O B. Among comparably populated cities, flights to those that are 100 miles away produce $150,000 more revenue per month, on average. O C. Among comparably populated cites, flights to those that are 100 miles away produce $8,400,000 more revenue per month, on average. OD. An interpretation of the partial slope for Distance cannot be determined given the data. (d) What is the interpretation of the partial slope for Population? O A. For every additional 1000 people in the population of feeder cities that are equally distant from the hub, revenues average $300 more per month. OB. For every additional 1000 people in the population of feeder cities that are equally distant from the hub, revenues average $84,000 more per month. ● C. For every additional 1000 people in the population of feeder cities that are equally distant from the hub, revenues average $1500 more per month. O D. An interpretation of the partial slope for Population cannot be determined given the data. (c) What is the interpretation of the partial slope for Distance? A. Among comparably populated cities, flights to those that are 100 miles away produce $30,000 more revenue per month, on average. O B. Among comparably populated cities, flights to those that are 100 miles away produce $150,000 more revenue per month, on average. O C. Among comparably populated cites, flights to those that are 100 miles away produce $8,400,000 more revenue per month, on average. OD. An interpretation of the partial slope for Distance cannot be determined given the data. (d) What is the interpretation of the partial slope for Population? O A. For every additional 1000 people in the population of feeder cities that are equally distant from the hub, revenues average $300 more per month. OB. For every additional 1000 people in the population of feeder cities that are equally distant from the hub, revenues average $84,000 more per month. ● C. For every additional 1000 people in the population of feeder cities that are equally distant from the hub, revenues average $1500 more per month. O D. An interpretation of the partial slope for Population cannot be determined given the data. An airline developed a regression model to predict revenue from flights that connect "feeder cities to its hub airport. The response in the model is the revenue generated by flights operating to the feeder cities (in thousands of dollars per month), and the two explanatory variables are the air distance between the hub and feeder city (Distance, in miles) and the population of the feeder city (in thousands). The least squares regression equation based on data for 37 feeder locations last month is Estimated revenue = 84 +0.3Distance +1.5Population with R² = 0.72 and s, 30.1. Complete parts a through d. (a) The airline plans to expand its operations to add an additional feeder city. The first possible city has population 100,000 and is 250 miles from the hub. A second possible city has population 130.000 and is 225 miles from the hub. Which would you recommend if the airline wants to increase total revenue? The second city O The first city (b) What is the interpretation of the intercept in this equation? OA. The intercept estimates fixed revenue based upon the distance between the hub and feeder city. B. The intercept estimates fixed revenue based upon the population of the feeder city. C. The intercept estimates fixed revenue regardless of distance or population, such as earnings from air freight D. An interpretation of the intercept cannot be determined given the data. (c) What is the interpretation of the partial slope for Distance? A. Among comparably populated cities, flights to those that are 100 miles away produce $30,000 more revenue per month, on average. O B. Among comparably populated cities, flights to those that are 100 miles away produce $150,000 more revenue per month, on average. O C. Among comparably populated cites, flights to those that are 100 miles away produce $8,400,000 more revenue per month, on average. OD. An interpretation of the partial slope for Distance cannot be determined given the data. (d) What is the interpretation of the partial slope for Population? O A. For every additional 1000 people in the population of feeder cities that are equally distant from the hub, revenues average $300 more per month. OB. For every additional 1000 people in the population of feeder cities that are equally distant from the hub, revenues average $84,000 more per month. ● C. For every additional 1000 people in the population of feeder cities that are equally distant from the hub, revenues average $1500 more per month. O D. An interpretation of the partial slope for Population cannot be determined given the data. (c) What is the interpretation of the partial slope for Distance? A. Among comparably populated cities, flights to those that are 100 miles away produce $30,000 more revenue per month, on average. O B. Among comparably populated cities, flights to those that are 100 miles away produce $150,000 more revenue per month, on average. O C. Among comparably populated cites, flights to those that are 100 miles away produce $8,400,000 more revenue per month, on average. OD. An interpretation of the partial slope for Distance cannot be determined given the data. (d) What is the interpretation of the partial slope for Population? O A. For every additional 1000 people in the population of feeder cities that are equally distant from the hub, revenues average $300 more per month. OB. For every additional 1000 people in the population of feeder cities that are equally distant from the hub, revenues average $84,000 more per month. ● C. For every additional 1000 people in the population of feeder cities that are equally distant from the hub, revenues average $1500 more per month. O D. An interpretation of the partial slope for Population cannot be determined given the data.
Expert Answer:
Answer rating: 100% (QA)
Answer a The airline should expand its operations to add the second city because it is closer to the hub and has a larger population b The intercept estimates the fixed revenue regardless of distance ... View the full answer

Related Book For 

Statistics for Business Decision Making and Analysis
ISBN: 978-0321890269
2nd edition
Authors: Robert Stine, Dean Foster
Posted Date:
Students also viewed these accounting questions
-
An airline developed a regression model to predict revenue from fights that connect feeder cities to its hub airport. The response in the model is the revenue generated by fights operating to the...
-
An analyst wants to build a regression model to predict spending from the following four predictor variables: Past Spending, Income, Net Worth and Age. A correlation matrix of the four predictors...
-
A marketing manager has developed a regression model to predict quarterly sales of his companys down jackets based on price and amount spent on advertising. An intern suggests that he include an...
-
Ford Company's cost of capital is 13%. It has invested x (million dollars) in current assets. The following function represents the shortage cost of its current assets: S = 9 e- x/3 Find the...
-
What can you do if your credit report contains inaccurate information?
-
Below is selected financial statement information for Verizon Communications Inc., taken from its 2010 annual report. Verizon's noncontrolling interest is comprised primarily of Vodafone's 45 percent...
-
Give a brief outline of the historical development of auditing.
-
Fixed-manufacturing overhead, variance analysis Esquire Clothing allocates fixed manufacturing overhead to each suit using budgeted direct manufacturing labor-hours per suit. Data pertaining to fixed...
-
1. Suppose that c is a constant for the power series [on?(x+1)", the interval of convergence n=0 is (-4, 2), find possible values of c
-
Perfect Parties, Inc. has several divisions, one of which provides birthday parties at their facility, and has provided the actual and planning budget results for the month of June. The Controller...
-
Alpha and Beta are divisions within the same company. The managers of both divisions are evaluated based on their own division's return on investment (ROI). Assume the following information relative...
-
How do non-coding RNAs, such as long non-coding RNAs and microRNAs, participate in chromosomal organization and gene regulation, and what are their functional roles in chromatin remodeling and...
-
Update the balance sheet to reflect the transactions: 1. Receive payment of $12,000 owed by a customer ----------------------------- Does not have an impact on A/P 2. Buy $15,000 worth of...
-
If there is a 30% chance of a 14% return, a 20% chance of an 18% return and a 50% chance of a 12% return, and the expected return is 13.8%, then what is the standard deviation of returns?
-
Suppose that the zero-coupon bond price associated with 4-years is 0.80, that is to say D4=0.80. What is the yield of this zero-coupon bond, y4?
-
the same current. 9) A transformer has an efficiency of 80 % and works at 100 V and 4 kW. If the secondary voltage is 240 V, Calculate the primary and secondary currents. 10) A coil of wire of 500...
-
In the triangle shown we can find the angle as follows a sin sin 1 b cos 1 8 cos 10 8 0 6
-
A genetically engineered strain of Escherichia coli (E. coli) is used to synthesize human insulin for people suffering from type I diabetes mellitus. In the following simplified reaction scheme,...
-
Exercise 44 summarizes results from a survey of stockholders following the October 1987 stock market crash. (a) Quantify the amount of association between the respondents stock ownership and...
-
A pharmaceutical company has developed a new drug that helps insomniacs sleep. In tests of the drug, it records the daily number of hours asleep and awake. Let X denote the number of hours awake and...
-
This data table tracks monthly performance of stock in Apple Computer since 1990. The data include 264 monthly returns on Apple Computer, as well as returns on the entire stock market, Treasury Bills...
-
Estimating service department labor cost using learning curves The warranty repair de- partment of the Biggie Company experiences a 90 percent learning curve effect on the repair of new products. The...
-
Learning curve formulas and tables The time required to build the first unit of a product with an 85 percent learning curve effect is 250 hours. A total of 15 units will be built. REQUIRED a. Use the...
-
Labor schedule with iearning curve costs Botega Company has just completed the first 30 units of a small single-engine airplane of a new design. The average labor cost for the 30 airplanes was...

Study smarter with the SolutionInn App