

An evaluation was recently performed on brands and data were collected that classified each brand as...
Fantastic news! We've Found the answer you've been seeking!
Question:
Transcribed Image Text:
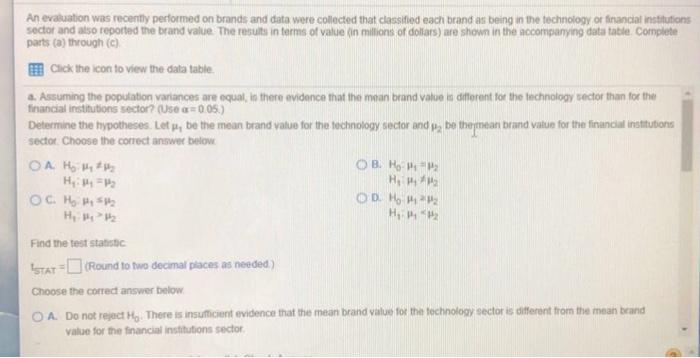
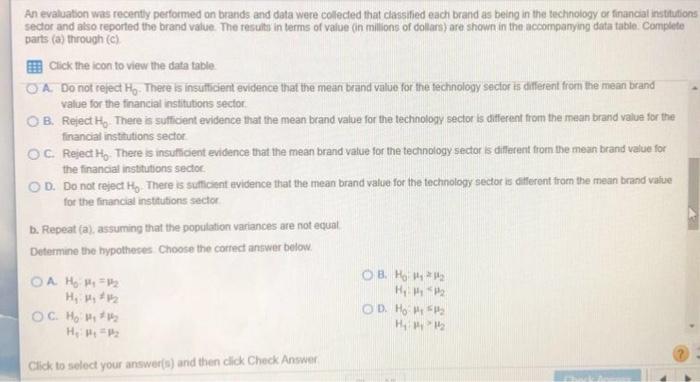
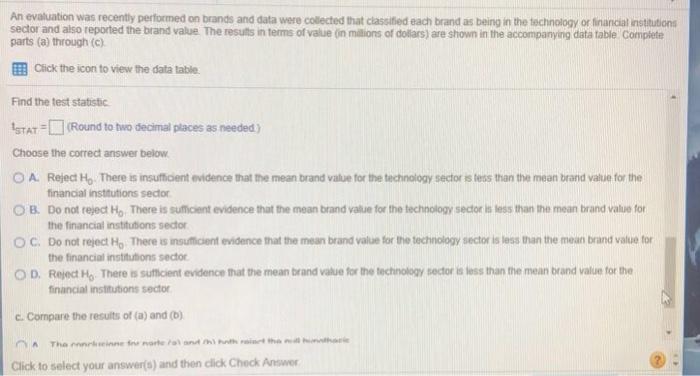
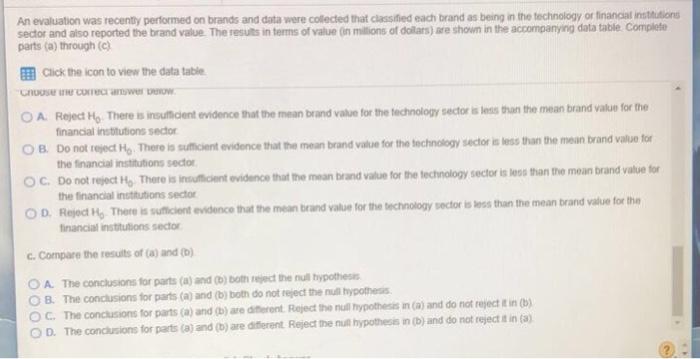
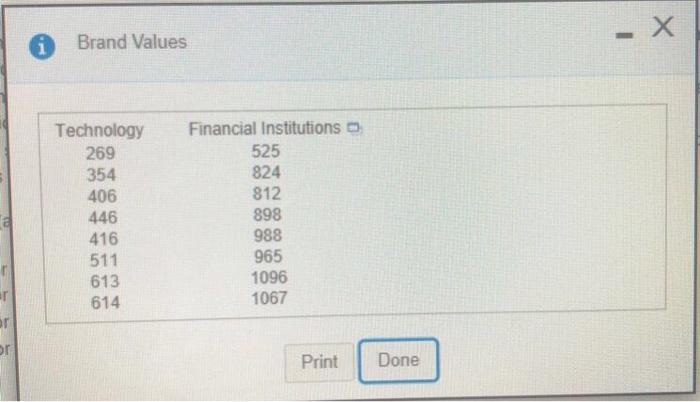
An evaluation was recently performed on brands and data were collected that classified each brand as being in the technology or financial institutions sector and also reported the brand value. The results in terms of value (in millions of dollars) are shown in the accompanying data table. Complete parts (a) through (c) Click the icon to view the data table. a. Assuming the population variances are equal, is there evidence that the mean brand value is different for the technology sector than for the financial institutions sector? (Use a 0.05.) Determine the hypotheses. Let u, be the mean brand value for the technology sector and p, be the mean brand value for the financial institutions sector. Choose the correct answer below OA H₂ #4₂ #1₂ H₁: Py = P₂ OC. H₂ Hy $1₂ H₂: PyP₂ Find the test statistic ISTAT (Round to two decimal places as needed.) Choose the correct answer below OB. HP P₂ H₂ P OD. H₂ ₂ H₂ P P₂ OA. Do not reject H. There is insufficient evidence that the mean brand value for the technology sector is different from the mean brand value for the financial institutions sector. An evaluation was recently performed on brands and data were collected that classified each brand as being in the technology or financial institutions sector and also reported the brand value. The results in terms of value (in millions of dollars) are shown in the accompanying datatable. Complete parts (a) through (c) Click the icon to view the data table A. Do not reject H.. There is insufficient evidence that the mean brand value for the technology sector is different from the mean brand value for the financial institutions sector B. Reject H. There is sufficient evidence that the mean brand value for the technology sector is different from the mean brand value for the financial institutions sector OC OD. Do not reject H, There is sufficient evidence that the mean brand value for the technology sector is different from the mean brand value for the financial institutions sector Reject Ho. There is insufficient evidence that the mean brand value for the technology sector is different from the mean brand value for the financial institutions sector. b. Repeat (a), assuming that the population variances are not equal Determine the hypotheses Choose the correct answer below. OA H₂ P₁ P₂ H₁ H₂ ##₂ OC. H₂ #₁ #₂ H₂ P₁ P₂ Click to select your answer(s) and then click Check Answer OB. H ₂ H₂ P P₂ OD. Ho: P H₂ 1 5₂ 1/₂ An evaluation was recently performed on brands and data were collected that classified each brand as being in the technology or financial institutions sector and also reported the brand value. The results in terms of value (in millions of dollars) are shown in the accompanying data table Complete parts (a) through (c). Click the icon to view the data table. Find the test statistic ISTAT (Round to two decimal places as needed.) Choose the correct answer below. OA. Reject Ho. There is insufficient evidence that the mean brand value for the technology sector is less than the mean brand value for the financial institutions sector. OB. Do not reject Ho. There is sufficient evidence that the mean brand value for the technology sector is less than the mean brand value for the financial institutions sector OC. Do not reject Ho There is insufficient evidence that the mean brand value for the technology sector is less than the mean brand value for the financial institutions sector OD. Reject H, There is sufficient evidence that the mean brand value for the technology sector is less than the mean brand value for the financial institutions sector c. Compare the results of (a) and (b) The moncleinne for norte /al and thi hoth raiart the hunthar Click to select your answer(s) and then click Check Answer An evaluation was recently performed on brands and data were collected that classified each brand as being in the technology or financial institutions sector and also reported the brand value. The results in terms of value (in millions of dollars) are shown in the accompanying data table Complete parts (a) through (c) Click the icon to view the data table Choose the correct answer below. OA Reject H₂ There is insufficient evidence that the mean brand value for the technology sector is less than the mean brand value for the financial institutions sector OB. Do not reject Ho. There is sufficient evidence that the mean brand value for the technology sector is less than the mean brand value for the financial institutions sector OC. Do not reject H, There is insufficient evidence that the mean brand value for the technology sector is less than the mean brand value for the financial institutions sector OD. Reject H, There is sufficient evidence that the mean brand value for the technology sector is less than the mean brand value for the financial institutions sector c. Compare the results of (a) and (b) A. The conclusions for parts (a) and (b) both reject the null hypothesis OB. The conclusions for parts (a) and (b) both do not reject the null hypothesis OC. The conclusions for parts (a) and (b) are different. Reject the null hypothesis in (a) and do not reject it in (b) OD. The conclusions for parts (a) and (b) are different Reject the null hypothesis in (b) and do not reject it in (a) or por Brand Values Technology Financial Institutions 269 354 406 446 416 511 613 614 525 824 812 898 988 965 1096 1067 Print Done - X An evaluation was recently performed on brands and data were collected that classified each brand as being in the technology or financial institutions sector and also reported the brand value. The results in terms of value (in millions of dollars) are shown in the accompanying data table. Complete parts (a) through (c) Click the icon to view the data table. a. Assuming the population variances are equal, is there evidence that the mean brand value is different for the technology sector than for the financial institutions sector? (Use a 0.05.) Determine the hypotheses. Let u, be the mean brand value for the technology sector and p, be the mean brand value for the financial institutions sector. Choose the correct answer below OA H₂ #4₂ #1₂ H₁: Py = P₂ OC. H₂ Hy $1₂ H₂: PyP₂ Find the test statistic ISTAT (Round to two decimal places as needed.) Choose the correct answer below OB. HP P₂ H₂ P OD. H₂ ₂ H₂ P P₂ OA. Do not reject H. There is insufficient evidence that the mean brand value for the technology sector is different from the mean brand value for the financial institutions sector. An evaluation was recently performed on brands and data were collected that classified each brand as being in the technology or financial institutions sector and also reported the brand value. The results in terms of value (in millions of dollars) are shown in the accompanying datatable. Complete parts (a) through (c) Click the icon to view the data table A. Do not reject H.. There is insufficient evidence that the mean brand value for the technology sector is different from the mean brand value for the financial institutions sector B. Reject H. There is sufficient evidence that the mean brand value for the technology sector is different from the mean brand value for the financial institutions sector OC OD. Do not reject H, There is sufficient evidence that the mean brand value for the technology sector is different from the mean brand value for the financial institutions sector Reject Ho. There is insufficient evidence that the mean brand value for the technology sector is different from the mean brand value for the financial institutions sector. b. Repeat (a), assuming that the population variances are not equal Determine the hypotheses Choose the correct answer below. OA H₂ P₁ P₂ H₁ H₂ ##₂ OC. H₂ #₁ #₂ H₂ P₁ P₂ Click to select your answer(s) and then click Check Answer OB. H ₂ H₂ P P₂ OD. Ho: P H₂ 1 5₂ 1/₂ An evaluation was recently performed on brands and data were collected that classified each brand as being in the technology or financial institutions sector and also reported the brand value. The results in terms of value (in millions of dollars) are shown in the accompanying data table Complete parts (a) through (c). Click the icon to view the data table. Find the test statistic ISTAT (Round to two decimal places as needed.) Choose the correct answer below. OA. Reject Ho. There is insufficient evidence that the mean brand value for the technology sector is less than the mean brand value for the financial institutions sector. OB. Do not reject Ho. There is sufficient evidence that the mean brand value for the technology sector is less than the mean brand value for the financial institutions sector OC. Do not reject Ho There is insufficient evidence that the mean brand value for the technology sector is less than the mean brand value for the financial institutions sector OD. Reject H, There is sufficient evidence that the mean brand value for the technology sector is less than the mean brand value for the financial institutions sector c. Compare the results of (a) and (b) The moncleinne for norte /al and thi hoth raiart the hunthar Click to select your answer(s) and then click Check Answer An evaluation was recently performed on brands and data were collected that classified each brand as being in the technology or financial institutions sector and also reported the brand value. The results in terms of value (in millions of dollars) are shown in the accompanying data table Complete parts (a) through (c) Click the icon to view the data table Choose the correct answer below. OA Reject H₂ There is insufficient evidence that the mean brand value for the technology sector is less than the mean brand value for the financial institutions sector OB. Do not reject Ho. There is sufficient evidence that the mean brand value for the technology sector is less than the mean brand value for the financial institutions sector OC. Do not reject H, There is insufficient evidence that the mean brand value for the technology sector is less than the mean brand value for the financial institutions sector OD. Reject H, There is sufficient evidence that the mean brand value for the technology sector is less than the mean brand value for the financial institutions sector c. Compare the results of (a) and (b) A. The conclusions for parts (a) and (b) both reject the null hypothesis OB. The conclusions for parts (a) and (b) both do not reject the null hypothesis OC. The conclusions for parts (a) and (b) are different. Reject the null hypothesis in (a) and do not reject it in (b) OD. The conclusions for parts (a) and (b) are different Reject the null hypothesis in (b) and do not reject it in (a) or por Brand Values Technology Financial Institutions 269 354 406 446 416 511 613 614 525 824 812 898 988 965 1096 1067 Print Done - X
Expert Answer:

Related Book For 

Introductory Statistics Exploring the World Through Data
ISBN: 978-0321978271
2nd edition
Authors: Robert Gould, Colleen Ryan
Posted Date:
Students also viewed these accounting questions
-
Complete parts a through c below for the continuous data in the accompanying table. Click the icon to view the data table. a) Construct a frequency distribution using the 2" zn rule. Select the...
-
Data were collected that included information on the weight of the trash (in pounds) on the street one week and the number of people who live in the house. The figure shows a scatterplot with the...
-
The data shown in the Table 8E.8 were collected in an experiment to optimize crystal growth as a function of three variables . Large values of y (yield in grams) are desirable. Fit a second-order...
-
Provide the appropriate statute for your answer (format style - IRAC - Issue, Rule, Application and Conclusion.) what are your thought? Problem Scenario- Earnest is married to Janice. Earnest and...
-
Explain what prototyping is and why it may be used on an e-commerce implementation.
-
At 25C and 101 kPa, 2 mol of a gas containing 35 mol% propylene in propane is equilibrated with 0.1 kg of silica gel adsorbent. Using the equilibrium data of Figure, calculate the moles and...
-
What is the velocity ratio of the third system of pulleys ?
-
Given a database of the results of an election, find the number of seats won by each party. There are some rules to going about this: There are many constituencies in a state and many candidates who...
-
An investor contributes $726.00 per quarter in an account that pays 4.20% APR with quarterly compounding. The first contribution will be made next quarter. What is the future value of this account?
-
The fraud triangle identifies conditions or circumstances that are often precursors to financial fraud. 1)Define the three categories of fraud risk factors that are included in the fraud triangle and...
-
Rowland Corporation was preparing its production budget for the first quarter of their first year of operations. The accountant has most of it completed but is missing a few numbers. Here is what she...
-
How is the receipt of a dividend recorded under the equity method? When investments are carried at fair value?
-
Evaluate each expression in Problems 3-32. \({ }_{9} P_{1}\)
-
In how many ways can four diamonds be drawn from a deck of cards?
-
Suppose you were hired for a job paying \(\$ 21,000\) per year and were given the following options: Option A: Annual salary increase of \(\$ 1,200\) Option B: Semiannual salary increase of \(\$...
-
A record company is planning to launch an Internet music service. Subscribers who pay \( 15\) per month will be allowed to download 100 songs per month to a personal computer. If the subscription...
-
Question 4 You have been given the following information for Innovative Inc, a publicly traded software company. This information is for next year After-tax operating income of $ 78 million Sales...
-
Solve for the equilibria of the following discrete-time dynamical systems Pr pt+1 = Pr+2.0(I-Pr)
-
The graph shows ages of females (labeled 1) and males (labeled 0) who are majoring in psychology in a four year college. a. Is this a histogram or a bar graph? How do you know? b. What type(s) of...
-
Refer to Exercise 12.10. "We randomly assigned adults undergoing clean-contaminated surgery in six hospitals to preoperative skin preparation with either chlorhexidine-alcohol scrub or...
-
Refer to Exercise 12.45. How could you find out whether iron caused the higher death rates associated in this study with its use? Describe the design of a study assuming you had 200 women to work...
-
Temperature is an intensive property. State True (T) or False (F)
-
Kinetic energy is an extensive property. State True (T) or False (F)
-
A nozzle represents an open system. State True (T) or False (F)

Study smarter with the SolutionInn App