

Question: An insurance company is backtesting its VaR methodology using data from March 6, 2017 to March 31, 2017 (i.e., a total of 20 daily observations).
An insurance company is backtesting its VaR methodology using data from March 6, 2017 to March 31, 2017 (i.e., a total of 20 daily observations). Table 1 shows the daily equity returns of the insurance company and the estimated daily 5% VaRs over this period. (a) What is the hit sequence for this 20 observations? (b) Calculate the likelihood ratio statistic for the unconditional coverage test. Would you reject the null hypothesis with 95% confidence? (Hint: The 95% quantile of X12 is 3.84) (c) Calculate the likelihood ratio statistic for the independence test. Would you reject the null hypothesis with 95% confidence? (Hint: The 95% quantile of X12 is 3.84)
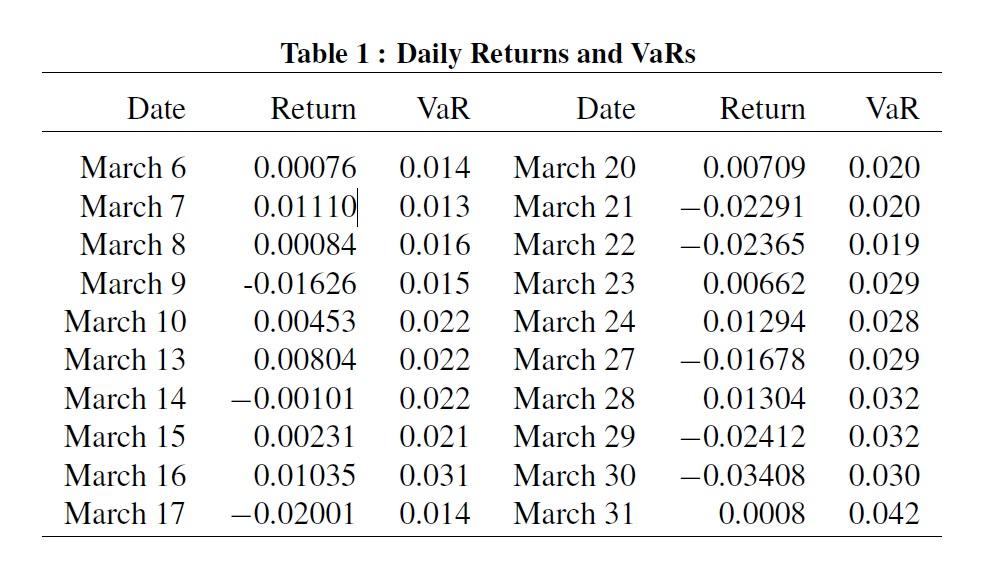
Table 1 : Daily Returns and VaRs Date Return VaR Date Return VaR March 6 March 7 March 8 March 9 March 10 March 13 March 14 March 15 March 16 March 17 0.00076 0.014 0.01110 0.013 0.00084 0.016 -0.01626 0.015 0.00453 0.022 0.00804 0.022 -0.00101 0.022 0.00231 0.021 0.01035 0.031 -0.02001 0.014 March 20 March 21 March 22 March 23 March 24 March 27 March 28 March 29 March 30 March 31 0.00709 -0.02291 -0.02365 0.00662 0.01294 -0.01678 0.01304 -0.02412 -0.03408 0.0008 0.020 0.020 0.019 0.029 0.028 0.029 0.032 0.032 0.030 0.042 Table 1 : Daily Returns and VaRs Date Return VaR Date Return VaR March 6 March 7 March 8 March 9 March 10 March 13 March 14 March 15 March 16 March 17 0.00076 0.014 0.01110 0.013 0.00084 0.016 -0.01626 0.015 0.00453 0.022 0.00804 0.022 -0.00101 0.022 0.00231 0.021 0.01035 0.031 -0.02001 0.014 March 20 March 21 March 22 March 23 March 24 March 27 March 28 March 29 March 30 March 31 0.00709 -0.02291 -0.02365 0.00662 0.01294 -0.01678 0.01304 -0.02412 -0.03408 0.0008 0.020 0.020 0.019 0.029 0.028 0.029 0.032 0.032 0.030 0.042
Step by Step Solution
There are 3 Steps involved in it

Get step-by-step solutions from verified subject matter experts