

Question: An operation analyst is forecasting this year's demand for one of his company's products based on the following historical data: YEAR QUANTITY SOLD Four
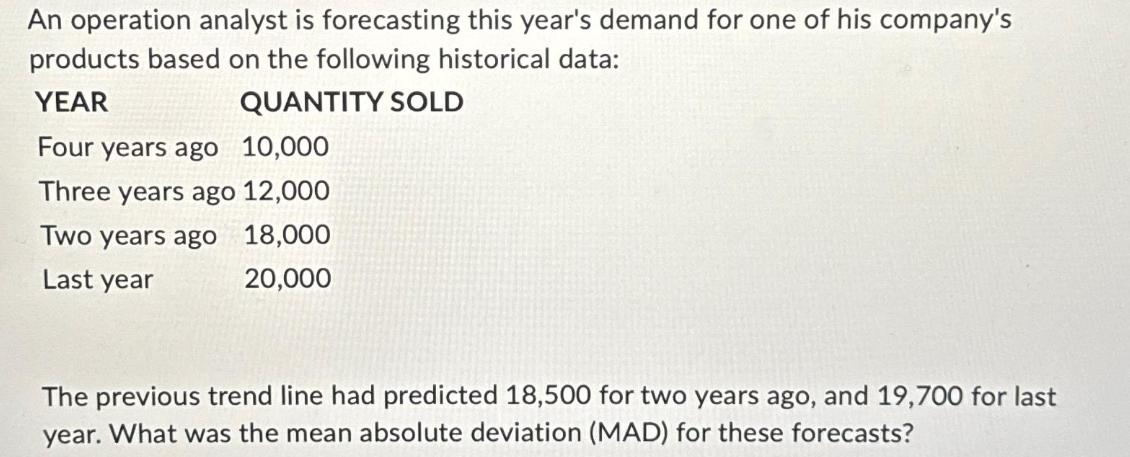
An operation analyst is forecasting this year's demand for one of his company's products based on the following historical data: YEAR QUANTITY SOLD Four years ago 10,000 Three years ago 12,000 Two years ago 18,000 Last year 20,000 The previous trend line had predicted 18,500 for two years ago, and 19,700 for last year. What was the mean absolute deviation (MAD) for these forecasts?
Step by Step Solution
There are 3 Steps involved in it
Based on the image the actual quantity sold two years ago was 18000 while the forecasted value was 18500 There is an absolute deviation of 500 The actual quantity sold last year was 20000 while the fo... View full answer

Get step-by-step solutions from verified subject matter experts