

Question: Analysis Need Time-series and cross-sectional analyses for both Microsoft and Dell. Please make graphs in Excel +Microsoft Income Statement 2019-2021 (In millions, except per share
Analysis
Need Time-series and cross-sectional analyses for both Microsoft and Dell.
Please make graphs in Excel
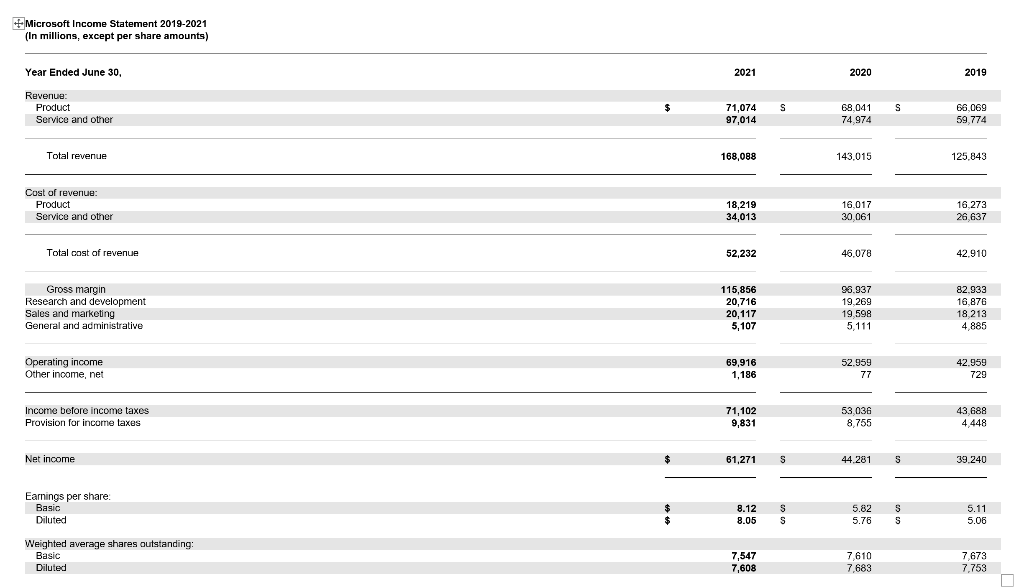
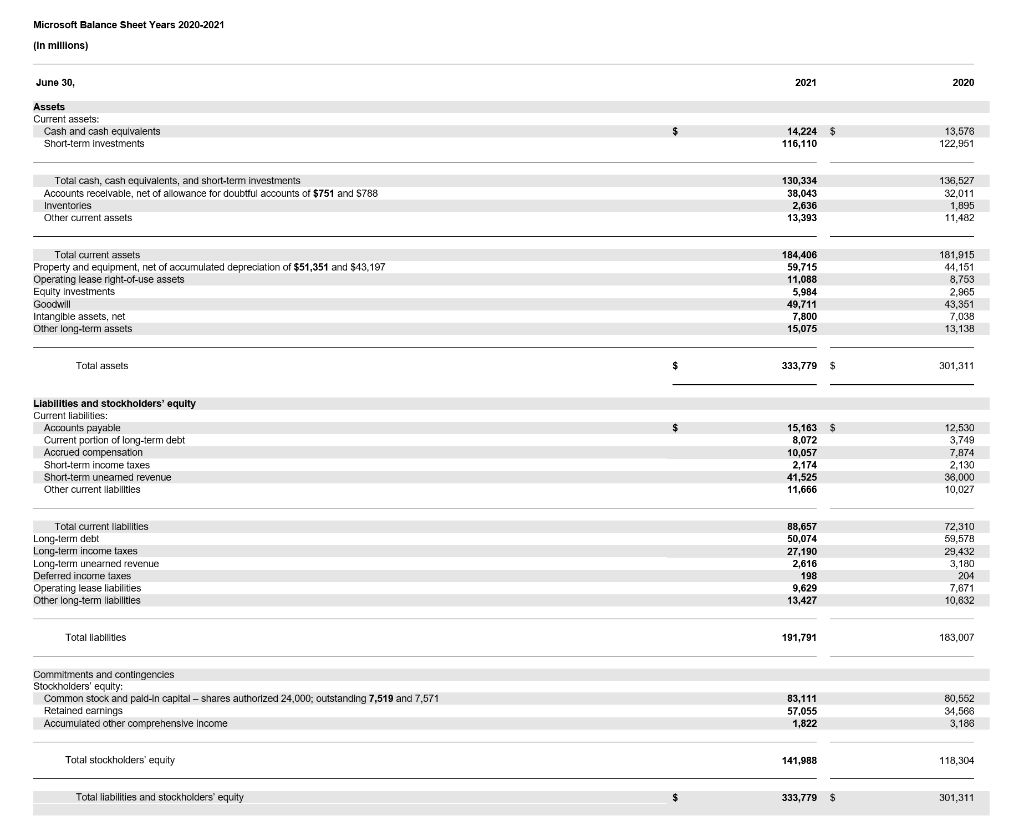
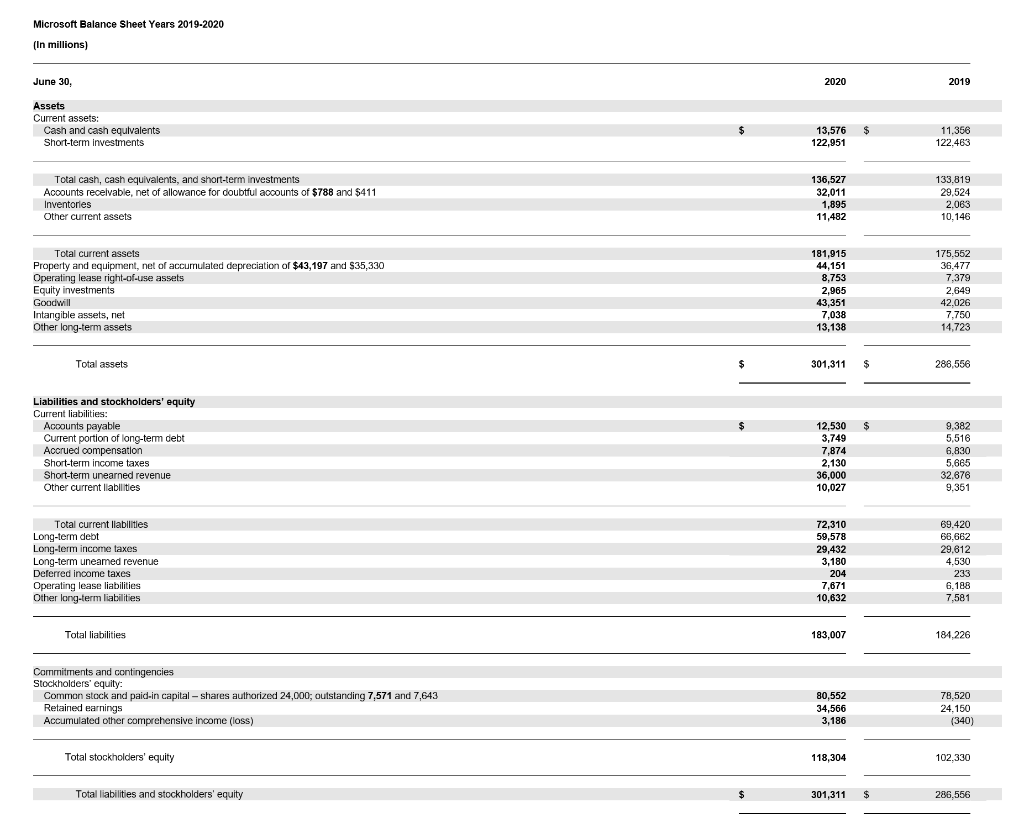
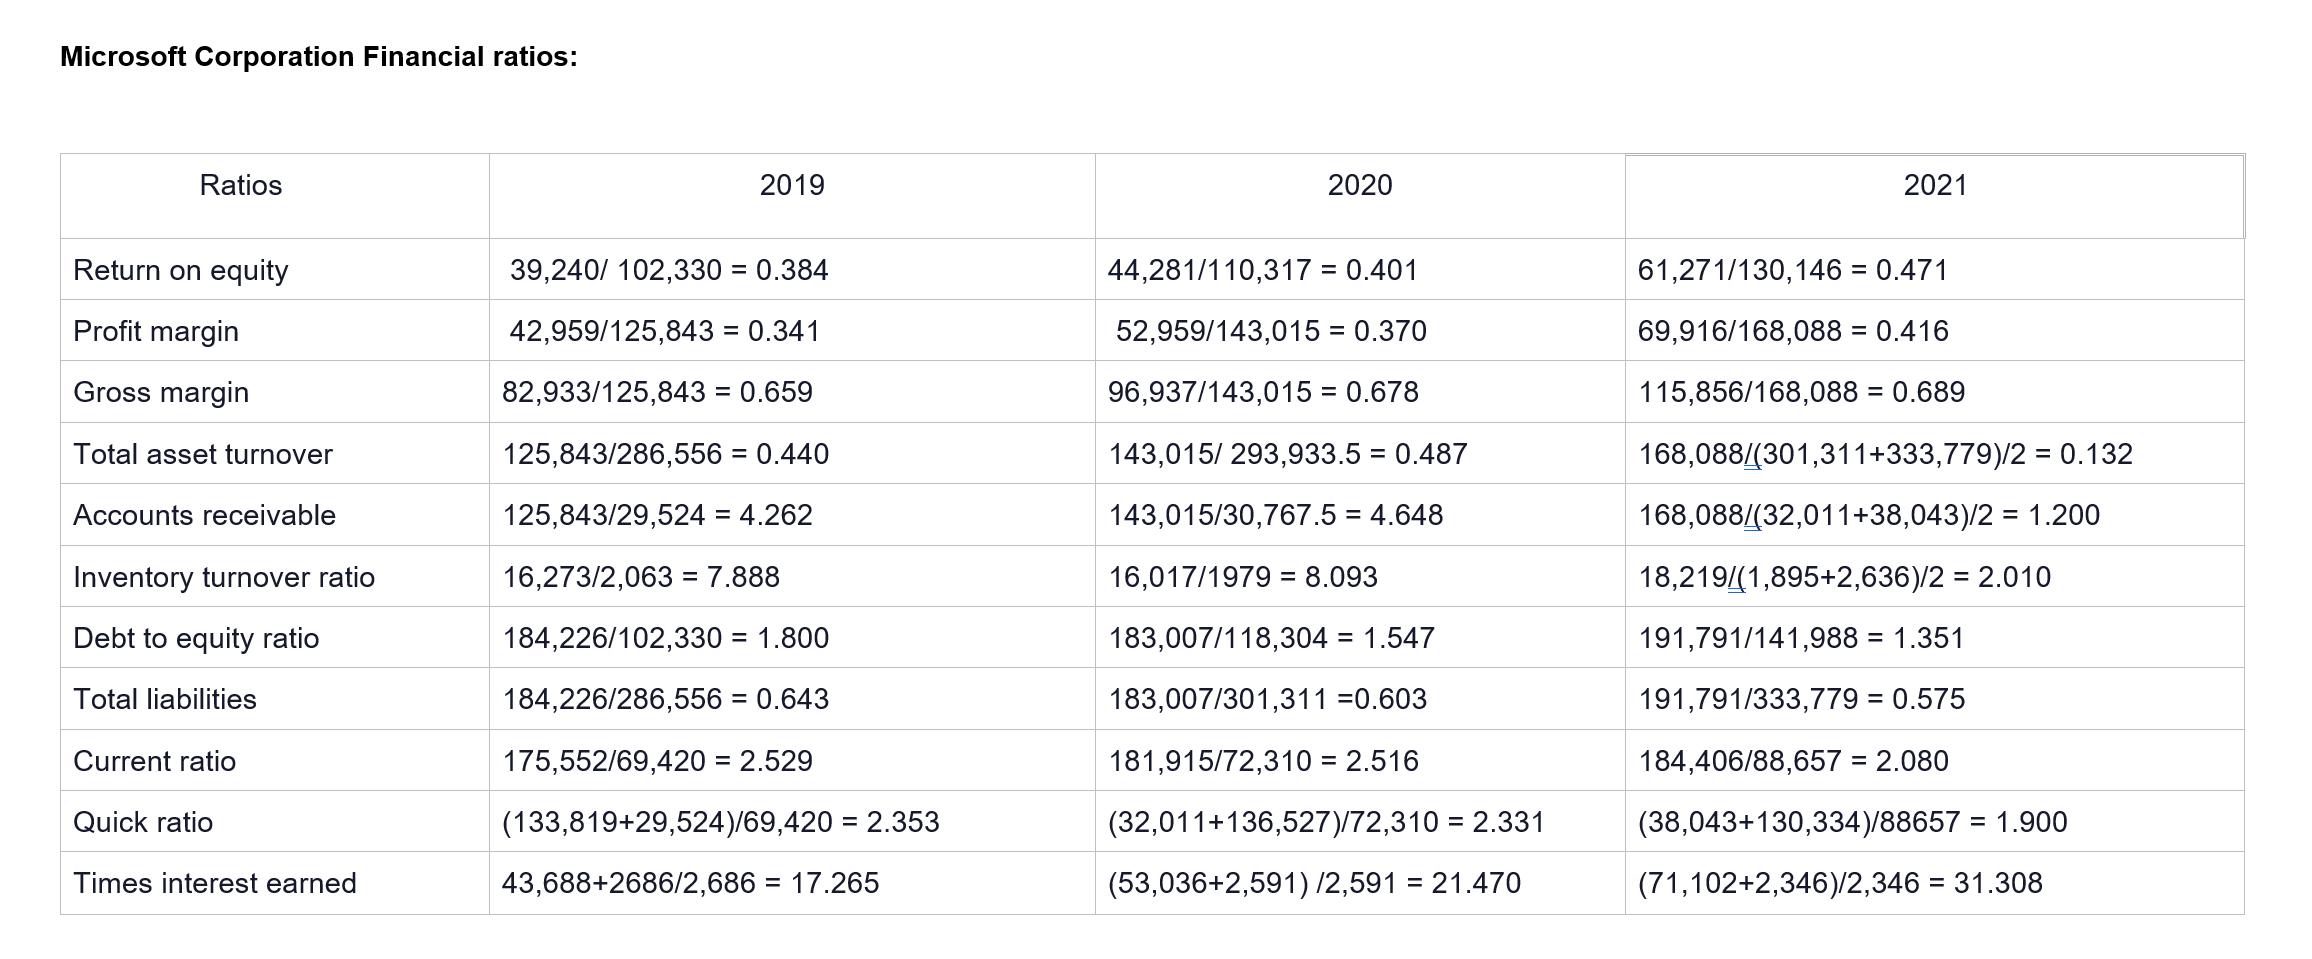
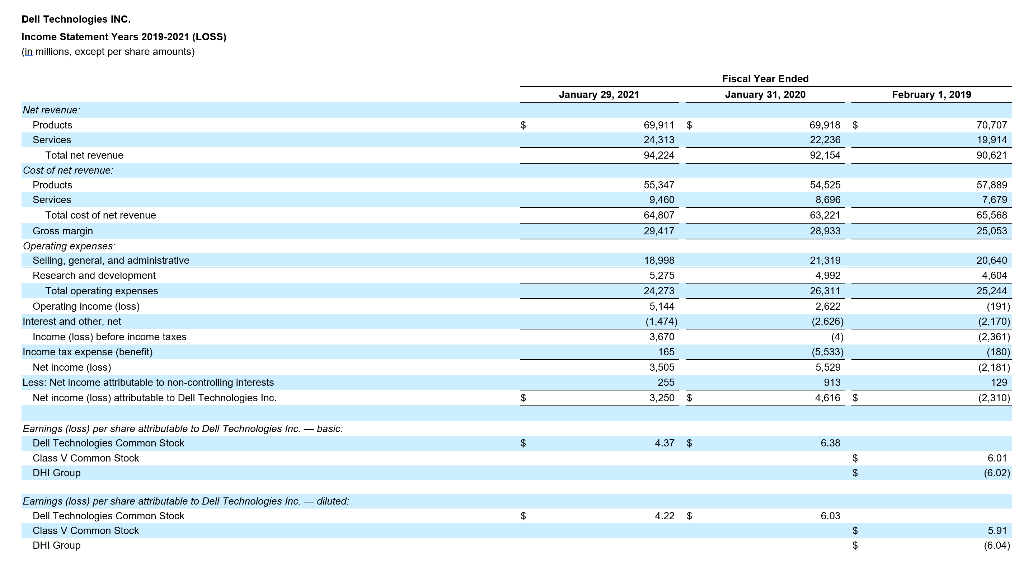
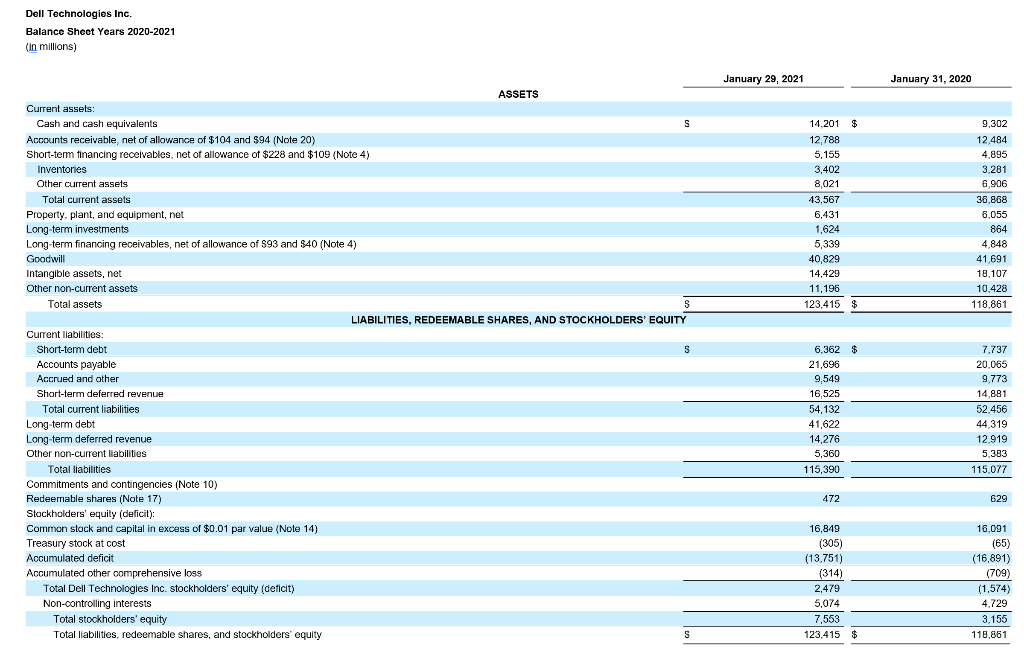
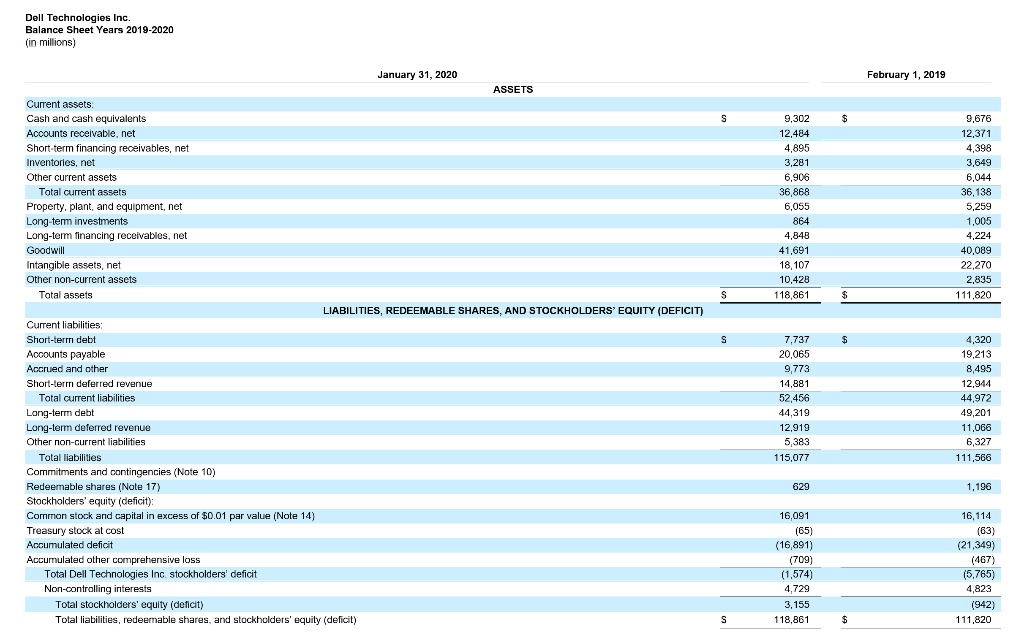
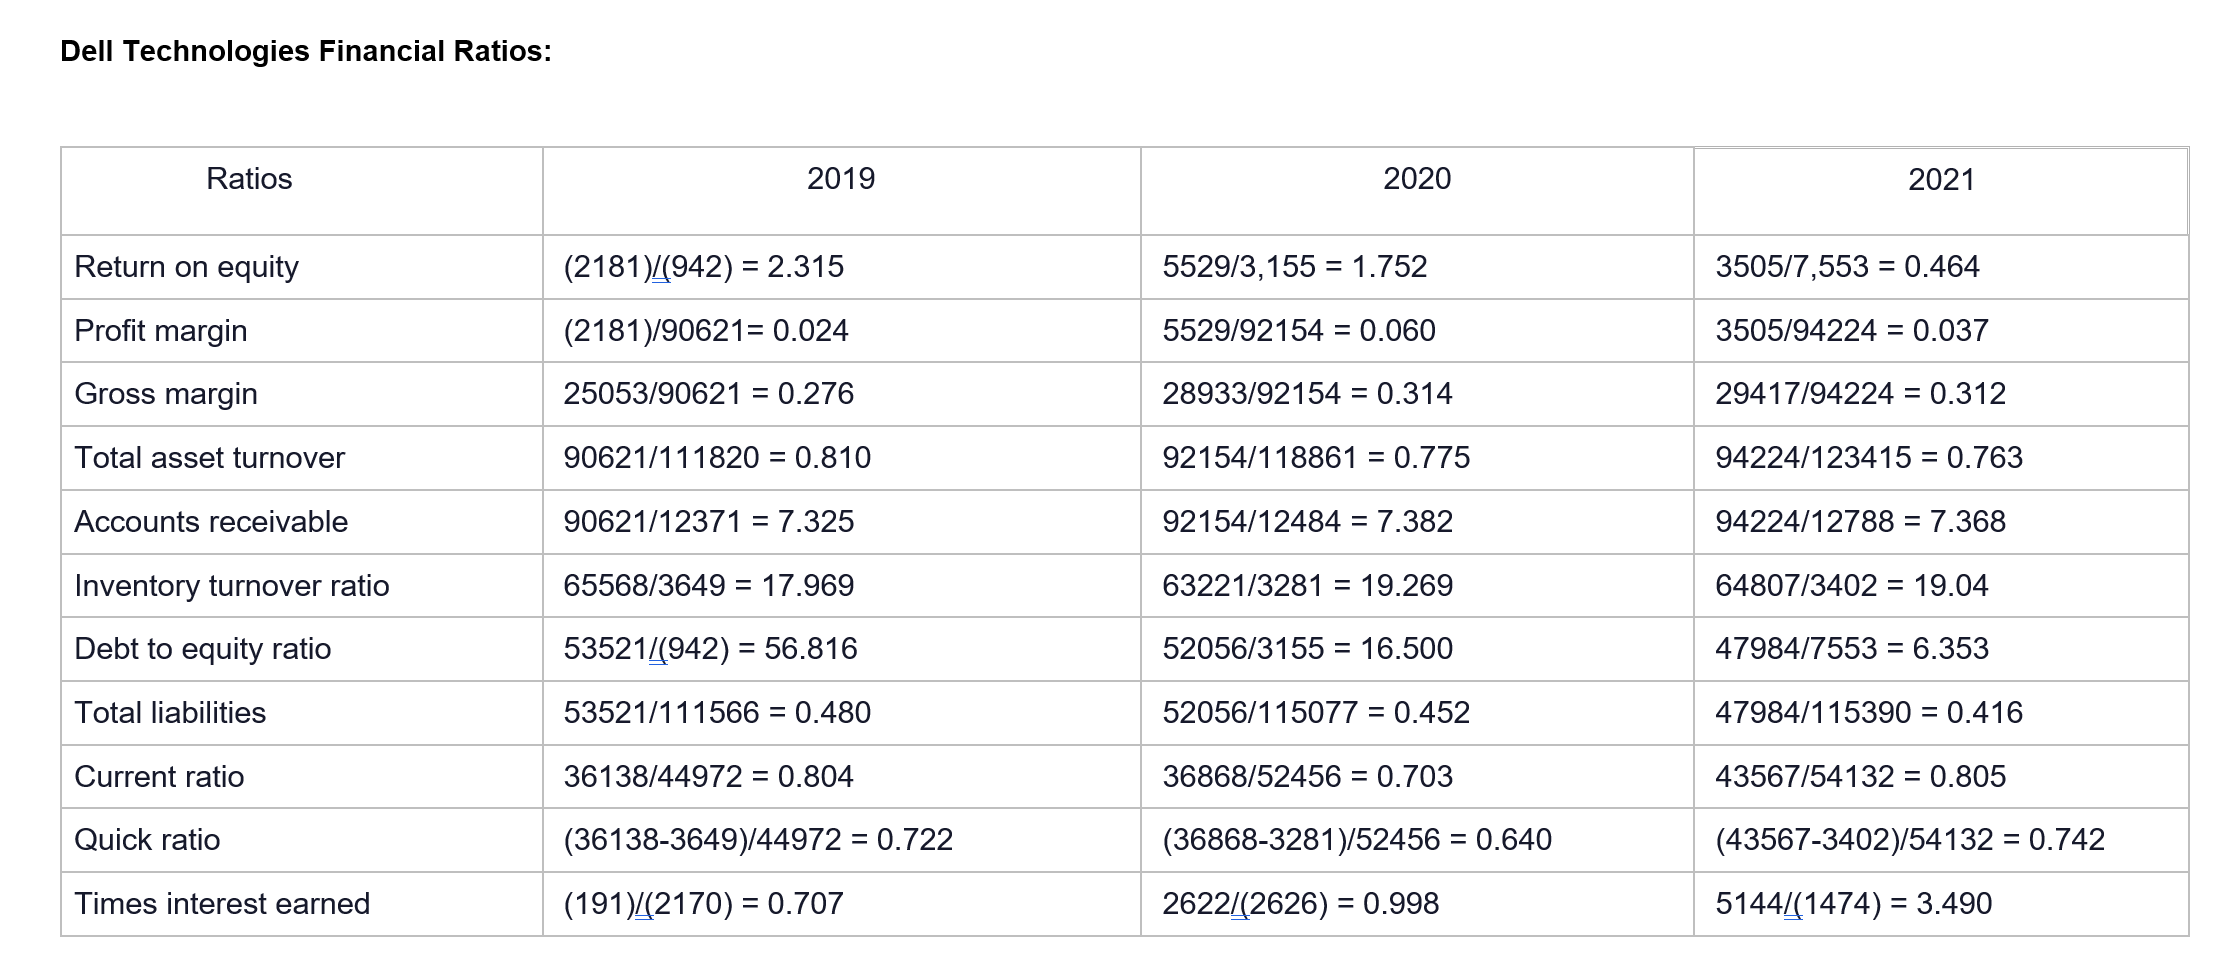
+Microsoft Income Statement 2019-2021 (In millions, except per share amounts) Year Ended June 30, Revenue: Product Service and other Total revenue Cost of revenue: Product Service and other Total cost of revenue Gross margin Research and development Sales and marketing General and administrative Operating income Other income, net Income before income taxes Provision for income taxes Net income Earnings per share: Basic Diluted Weighted average shares outstanding: Basic Diluted $ $ 2021 71,074 97,014 168,088 18,219 34,013 52,232 115,856 20,716 20,117 5,107 69,916 1,186 71,102 9,831 61,271 8.12 8.05 7,547 7,608 S S S S 2020 68,041 74,974 143,015 16,017 30,061 46,078 96.937 19,269 19,598 5,111 52,959 77 53,036 8,755 44.281 5.82 5.76 7,610 7.683 S S ass 2019 66,069 59,774 125.843 16,273 26,637 42.910 82.933 16,876 18,213 4,885 42.959 729 43,688 4,448 39,240 5.11 5.06 7,673 7,753 n Microsoft Balance Sheet Years 2020-2021 (In millions) June 30, Assets Current assets: Cash and cash equivalents Short-term investments Total cash, cash equivalents, and short-term investments Accounts receivable, net of allowance for doubtful accounts of $751 and $788 Inventories Other current assets Total current assets Property and equipment, net of accumulated depreciation of $51,351 and $43,197 Operating lease right-of-use assets Equity Investments Goodwill Intangible assets, net Other long-term assets Total assets Liabilities and stockholders' equity Current liabilities: Accounts payable Current portion of long-term debt Accrued compensation Short-term income taxes Short-term unearned revenue Other current llabilities Total current liabilities Long-term debt Long-term income taxes Long-term unearned revenue Deferred income taxes Operating lease liabilities Other long-term liabilities Total liabilities Commitments and contingencies Stockholders' equity: Common stock and paid-in capital - shares authorized 24,000; outstanding 7,519 and 7,571 Retained earnings Accumulated other comprehensive Income Total stockholders' equity Total liabilities and stockholders' equity $ 2021 14,224 116,110 130,334 38,043 2,636 13,393 184,406 59,715 11.088 5,984 49,711 7,800 15,075 333,779 15,163 8,072 10,057 2,174 41,525 11,666 88,657 50,074 27,190 2,616 198 9,629 13,427 191,791 83,111 57,055 1,822 141,988 333,779 $ $ $ $ 2020 13,576 122,951 136,527 32,011 1,895 11,482 181,915 44,151 8,753 2,965 43,351 7,038 13,138 301,311 12,530 3,749 7,874 2,130 36,000 10,027 72,310 59,578 29,432 3,180 204 7,671 10,632 183,007 80,552 34,566 3,188 118,304 301,311 Microsoft Balance Sheet Years 2019-2020 (In millions) June 30, Assets Current assets: Cash and cash equivalents Short-term investments Total cash, cash equivalents, and short-term investments Accounts receivable, net of allowance for doubtful accounts of $788 and $411 Inventories Other current assets Total current assets Property and equipment, net of accumulated depreciation of $43,197 and $35,330 Operating lease right-of-use assets Equity investments Goodwill Intangible assets, net Other long-term assets Total assets Liabilities and stockholders' equity Current liabilities: Accounts payable Current portion of long-term debt Accrued compensation Short-term income taxes Short-term unearned revenue Other current liabilities Total current liabilities Long-term debt Long-term income taxes Long-term uneamed revenue Deferred income taxes Operating lease liabilities Other long-term liabilities Total liabilities Commitments and contingencies Stockholders' equity: Common stock and paid-in capital - shares authorized 24,000; outstanding 7,571 and 7,643 Retained earnings Accumulated other comprehensive income (loss) Total stockholders' equity Total liabilities and stockholders' equity 2020 13,576 $ 122,951 136,527 32,011 1,895 11,482 181,915 44,151 8,753 2,965 43,351 7,038 13,138 301,311 $ $ 12,530 3,749 7,874 2,130 36,000 10,027 72,310 59,578 29,432 3,180 204 7,671 10,632 183,007 80,552 34,566 3,186 118,304 301,311 $ 2019 11,356 122,463 133,819 29,524 2,063 10,146 175,552 36,477 7,379 2,649 42,026 7,750 14.723 288.556 9,382 5,516 6,830 5,665 32,676 9,351 69,420 66.662 29,612 4,530 233 6,188 7,581 184,226 78,520 24.150 (340) 102,330 286,556 Microsoft Corporation Financial ratios: Ratios Return on equity Profit margin Gross margin Total asset turnover Accounts receivable Inventory turnover ratio Debt to equity ratio Total liabilities Current ratio Quick ratio Times interest earned 2019 39,240/ 102,330 = 0.384 42,959/125,843 = 0.341 82,933/125,843 = 0.659 125,843/286,556 = 0.440 125,843/29,524 = 4.262 16,273/2,063 = 7.888 184,226/102,330 = 1.800 184,226/286,556 = 0.643 175,552/69,420 = 2.529 (133,819+29,524)/69,420 = 2.353 43,688+2686/2,686 = 17.265 2020 44,281/110,317 = 0.401 52,959/143,015 = 0.370 96,937/143,015 = 0.678 143,015/ 293,933.5 = 0.487 143,015/30,767.5 = 4.648 16,017/1979 = 8.093 183,007/118,304 = 1.547 183,007/301,311 =0.603 181,915/72,310 = 2.516 (32,011+136,527)/72,310 = 2.331 (53,036+2,591) /2,591 = 21.470 2021 61,271/130,146 = 0.471 69,916/168,088 = 0.416 115,856/168,088 = 0.689 168,088/(301,311+333,779)/2 = 0.132 168,088/(32,011+38,043)/2 = 1.200 18,219/(1,895+2,636)/2 = 2.010 191,791/141,988 = 1.351 191,791/333,779 = 0.575 184,406/88,657 = 2.080 (38,043+130,334)/88657 = 1.900 (71,102+2,346)/2,346 = 31.308 Dell Technologies INC. Income Statement Years 2019-2021 (LOSS) (in millions, except per share amounts) Net revenue: Products Services Total net revenue Cost of net revenue: Products Services Total cost of net revenue Gross margin Operating expenses: Selling, general, and administrative Research and development Total operating expenses Operating Income (loss) Interest and other. net Income (loss) before income taxes Income tax expense (benefit) Net Income (loss) Less: Net income attributable to non-controlling interests Net income (loss) attributable to Dell Technologies Inc. Earnings (loss) per share attributable to Dell Technologies Inc. - basic: Dell Technologies Common Stock Class V Common Stock DHI Group Earnings (loss) per share attributable to Dell Technologies Inc. diluted: Dell Technologies Common Stock Class V Common Stock DHI Group $ $ $ $ January 29, 2021 69,911 $ 24,313 94.224 55,347 9,460 64,807 29,417 18.998 5,275 24,273 5.144 (1.474) 3,670 165 3,505 255 3,250 $ 4.37 $ 4.22 $ Fiscal Year Ended January 31, 2020 69,918 $ 22,236 92,154 54,525 8,696 63,221 28,933 21,319 4,992 26,311 2,622 (2.626) (4) (5,533) 5,529 913 4,616 $ 6.38 6.03 $ $ $ $ February 1, 2019 70,707 19,914 90,621 57,889 7,679 65,568 25,053 20,640 4,604 25,244 (191) (2,170) (2,361) (180) (2,181) 129 (2,310) 6.01 (6.02) 5.91 (6.04) Dell Technologies Inc. Balance Sheet Years 2020-2021 (in millions) Current assets: Cash and cash equivalents Accounts receivable, net of allowance of $104 and $94 (Note 20) Short-term financing receivables, net of allowance of $228 and $109 (Note 4) Inventories Other current assets. Total current assets Property, plant, and equipment, net Long-term investments Long-term financing receivables, net of allowance of $93 and $40 (Note 4) Goodwill Intangible assets, net Other non-current assets Total assets Current liabilities: Short-term debt Accounts payable Accrued and other Short-term deferred revenue Total current liabilities Long-term debt Long-term deferred revenue Other non-current liabilities Total liabilities Commitments and contingencies (Note 10) Redeemable shares (Note 17) Stockholders' equity (deficit): Common stock and capital in excess of $0.01 par value (Note 14) Treasury stock at cost Accumulated deficit Accumulated other comprehensive loss Total Dell Technologies Inc. stockholders' equity (deficit) Non-controlling interests Total stockholders' equity Total liabilities, redeemable shares, and stockholders' equity ASSETS S LIABILITIES, REDEEMABLE SHARES, AND STOCKHOLDERS' EQUITY S S S January 29, 2021 14,201 $ 12,788 5,155 3,402 8,021 43,567 6,431 1.624 5,339 40,829 14,429 11,196 123,415 $ 6.362 $ 21,696 9,549 16,525 54,132 41,622 14,276 5,360 115,390 472 16,849 (305) (13,751) (314) 2,479 5,074 7,553 123,415 $ January 31, 2020 9,302 12,484 4,895 3,281 6,906 36,868 6,055 864 4848 41.691 18,107 10.428 118,861 7,737 20,065 9,773 14,881 52,456 44.319 12,919 5,383 115,077 629 16,091 (65) (16,891) (709) (1,574) 4,729 3,155 118,861 Dell Technologies Inc. Balance Sheet Years 2019-2020 (in millions) Current assets: Cash and cash equivalents Accounts receivable, net Short-term financing receivables, net Inventories, net Other current assets Total current assets Property, plant, and equipment, net Long-term investments Long-term financing receivables, net Goodwill Intangible assets, net Other non-current assets Total assets Current liabilities: Short-term debt Accounts payable Accrued and other Short-term deferred revenue Total current liabilities. Long-term debt Long-term deferred revenue Other non-current liabilities Total liabilities Commitments and contingencies (Note 10) Redeemable shares (Note 17) Stockholders' equity (deficit): Common stock and capital in excess of $0.01 par value (Note 14) Treasury stock at cost Accumulated deficit Accumulated other comprehensive loss Total Dell Technologies Inc. stockholders' deficit Non-controlling interests Total stockholders' equity (deficit) Total liabilities, redeemable shares, and stockholders' equity (deficit) January 31, 2020 ASSETS S LIABILITIES, REDEEMABLE SHARES, AND STOCKHOLDERS' EQUITY (DEFICIT) S S S 9,302 12,484 4,895 3,281 6,906 36.868 6,055 864 4,848 41,691 18,107 10,428 118,861 7,737 20,065 9,773 14,881 52,456 44,319 12,919 5,383 115,077 629 16,091 (65) (16,891) (709) (1,574) 4,729 3,155 118,861 $ $ $ $ February 1, 2019 9,676 12,371 4,398 3,649 6,044 36,138 5,259 1,005 4,224 40,089 22,270 2,835 111,820 4,320 19,213 8,495 12,944 44,972 49,201 11,066 6,327 111,566 1,196 16,114 (63) (21,349) (467) (5,765) 4,823 (942) 111,820 Dell Technologies Financial Ratios: Ratios Return on equity Profit margin Gross margin Total asset turnover Accounts receivable Inventory turnover ratio Debt to equity ratio Total liabilities Current ratio Quick ratio Times interest earned 2019 (2181)/(942) = 2.315 (2181)/90621= 0.024 25053/90621 = 0.276 90621/111820 = 0.810 90621/12371 = 7.325 65568/3649 = 17.969 53521/(942) = 56.816 53521/111566 = 0.480 36138/44972 = 0.804 (36138-3649)/44972 = 0.722 (191)/(2170) = 0.707 2020 5529/3,155 1.752 5529/92154 = 0.060 28933/92154 = 0.314 92154/118861 = 0.775 92154/12484 = 7.382 63221/3281 = 19.269 52056/3155 = 16.500 52056/115077 = 0.452 36868/52456 = 0.703 (36868-3281)/52456 = 0.640 2622/(2626) = 0.998 2021 3505/7,553 = 0.464 3505/94224 = 0.037 29417/94224 = 0.312 94224/123415 = 0.763 94224/12788 = 7.368 64807/3402 = 19.04 47984/7553 = 6.353 47984/115390 = 0.416 43567/54132 = 0.805 (43567-3402)/54132 = 0.742 5144/(1474) = 3.490
Step by Step Solution
There are 3 Steps involved in it

Get step-by-step solutions from verified subject matter experts