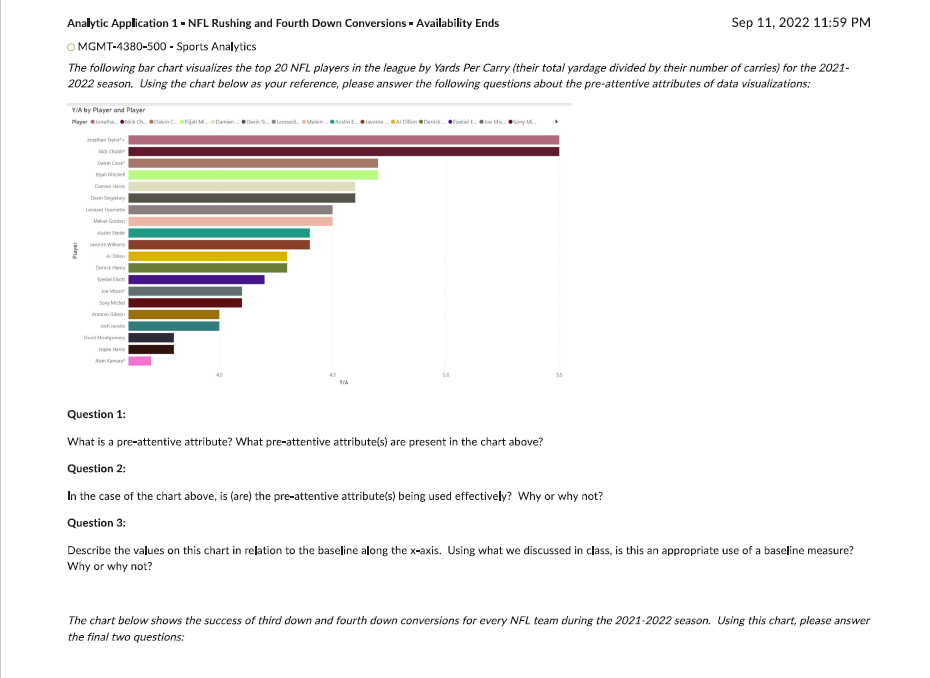
Question: Analytic Application 1 - NFL Rushing and Fourth Down Conversions - Availability Ends Sep 11, 2022 11:59 PM MGMT-4380-500 - Sports Analytics The following bar

Analytic Application 1 - NFL Rushing and Fourth

Analytic Application 1 - NFL Rushing and Fourth Down Conversions - Availability Ends Sep 11, 2022 11:59 PM MGMT-4380-500 - Sports Analytics The following bar chart visualizes the top 20 NFL players in the league by Yards Per Carry (their total yardage divided by their number of carries) for the 2022 season. Using the chart below as your reference, please answer the following questions about the pre-attentive attributes of data visualizations: Question 1: What is a pre-attentive attribute? What pre-attentive attribute(s) are present in the chart above? Question 2: In the case of the chart above, is (are) the pre-attentive attribute(s) being used effectively? Why or why not? Question 3: Describe the values on this chart in relation to the baseline along the x-axis. Using what we discussed in class, is this an appropriate use of a baseline measure? Why or why not? The chart below shows the success of third down and fourth down conversions for every NFL team during the 2021-2022 season. Using this chart, please the final two questions

Step by Step Solution

There are 3 Steps involved in it

1 Expert Approved Answer
Step: 1 Unlock blur-text-image
Question Has Been Solved by an Expert!

Get step-by-step solutions from verified subject matter experts

Step: 2 Unlock
Step: 3 Unlock

Students Have Also Explored These Related General Management Questions!