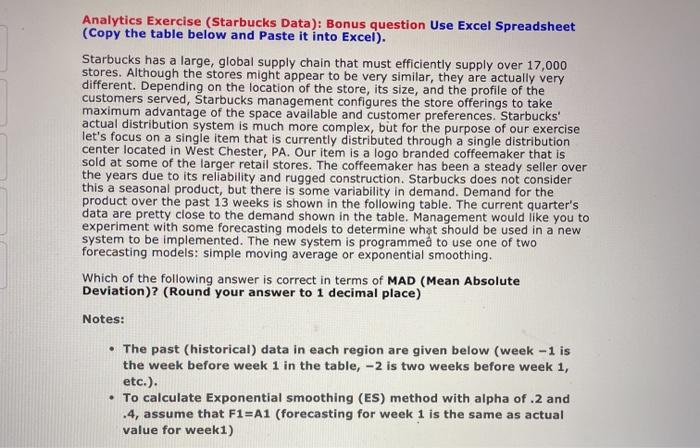
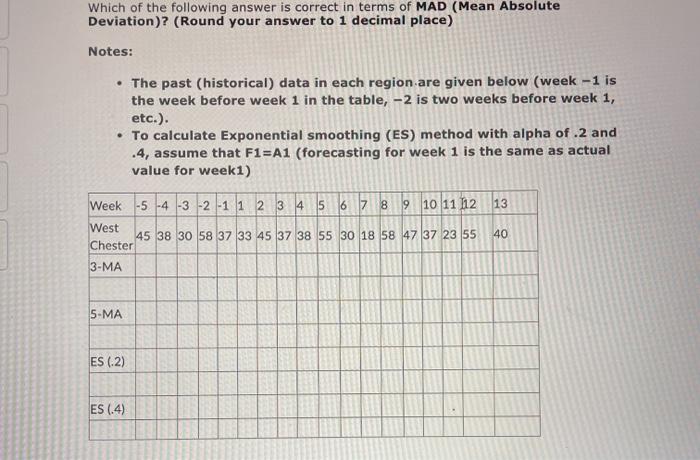
Question: Analytics Exercise (Starbucks Data): Bonus question Use Excel Spreadsheet (Copy the table below and Paste it into Excel). Starbucks has a large, global supply chain

Analytics Exercise (Starbucks Data): Bonus
Analytics Exercise (Starbucks Data): Bonus question Use Excel Spreadsheet (Copy the table below and Paste it into Excel). Starbucks has a large, global supply chain that must efficiently supply over 17,000 stores. Although the stores might appear to be very similar, they are actually very different. Depending on the location of the store, its size, and the profile of the customers served, Starbucks management configures the store offerings to take maximum advantage of the space available and customer preferences. Starbucks' actual distribution system is much more complex, but for the purpose of our exercise let's focus on a single item that is currently distributed through a single distribution center located in West Chester, PA. Our item is a logo branded coffeemaker that is sold at some of the larger retail stores. The coffeemaker has been a steady seller over the years due to its reliability and rugged construction. Starbucks does not consider this a seasonal product, but there is some variability in demand. Demand for the product over the past 13 weeks is shown in the following table. The current quarter's data are pretty close to the demand shown in the table. Management would like you to experiment with some forecasting models to determine what should be used in a new system to be implemented. The new system is programmed to use one of two forecasting models: simple moving average or exponential smoothing. Which of the following answer is correct in terms of MAD (Mean Absolute Deviation)? (Round your answer to 1 decimal place) Notes: The past (historical) data in each region are given below (week - 1 is the week before week 1 in the table, -2 is two weeks before week 1, etc.) To calculate Exponential smoothing (ES) method with alpha of .2 and .4, assume that F1=A1 (forecasting for week 1 is the same as actual value for week1) Which of the following answer is correct in terms of MAD (Mean Absolute Deviation)? (Round your answer to 1 decimal place) Notes: The past (historical) data in each region are given below (week -1 is the week before week 1 in the table, -2 is two weeks before week 1, etc.). To calculate Exponential smoothing (ES) method with alpha of .2 and .4, assume that F1=A1 (forecasting for week 1 is the same as actual value for week1) 13 Week -5 -4 -3 -2 -1 1 2 3 4 5 6 7 8 9 10 11 12 West 45 38 30 58 37 33 45 37 38 55 30 18 58 47 37 23 55 Chester 3-MA 40 5-MA ES (2) ES (4) 5-Month moving average = MAD (11.4) 3-Month moving average = MAD (11.2) Exponential smoothing with alpha .4 = MAD (10.4) Exponential smoothing with alpha .2 = MAD (10.4)

Step by Step Solution

There are 3 Steps involved in it

1 Expert Approved Answer
Step: 1 Unlock blur-text-image
Question Has Been Solved by an Expert!

Get step-by-step solutions from verified subject matter experts

Step: 2 Unlock
Step: 3 Unlock

Students Have Also Explored These Related General Management Questions!