

Question: Analyze Case 7 Moving Averages and Smoothing Methods CASE 7 SOUTHWEST MEDICAL CENTER Mary Beasley is responsible for keeping track of the number of billable
Analyze Case 7
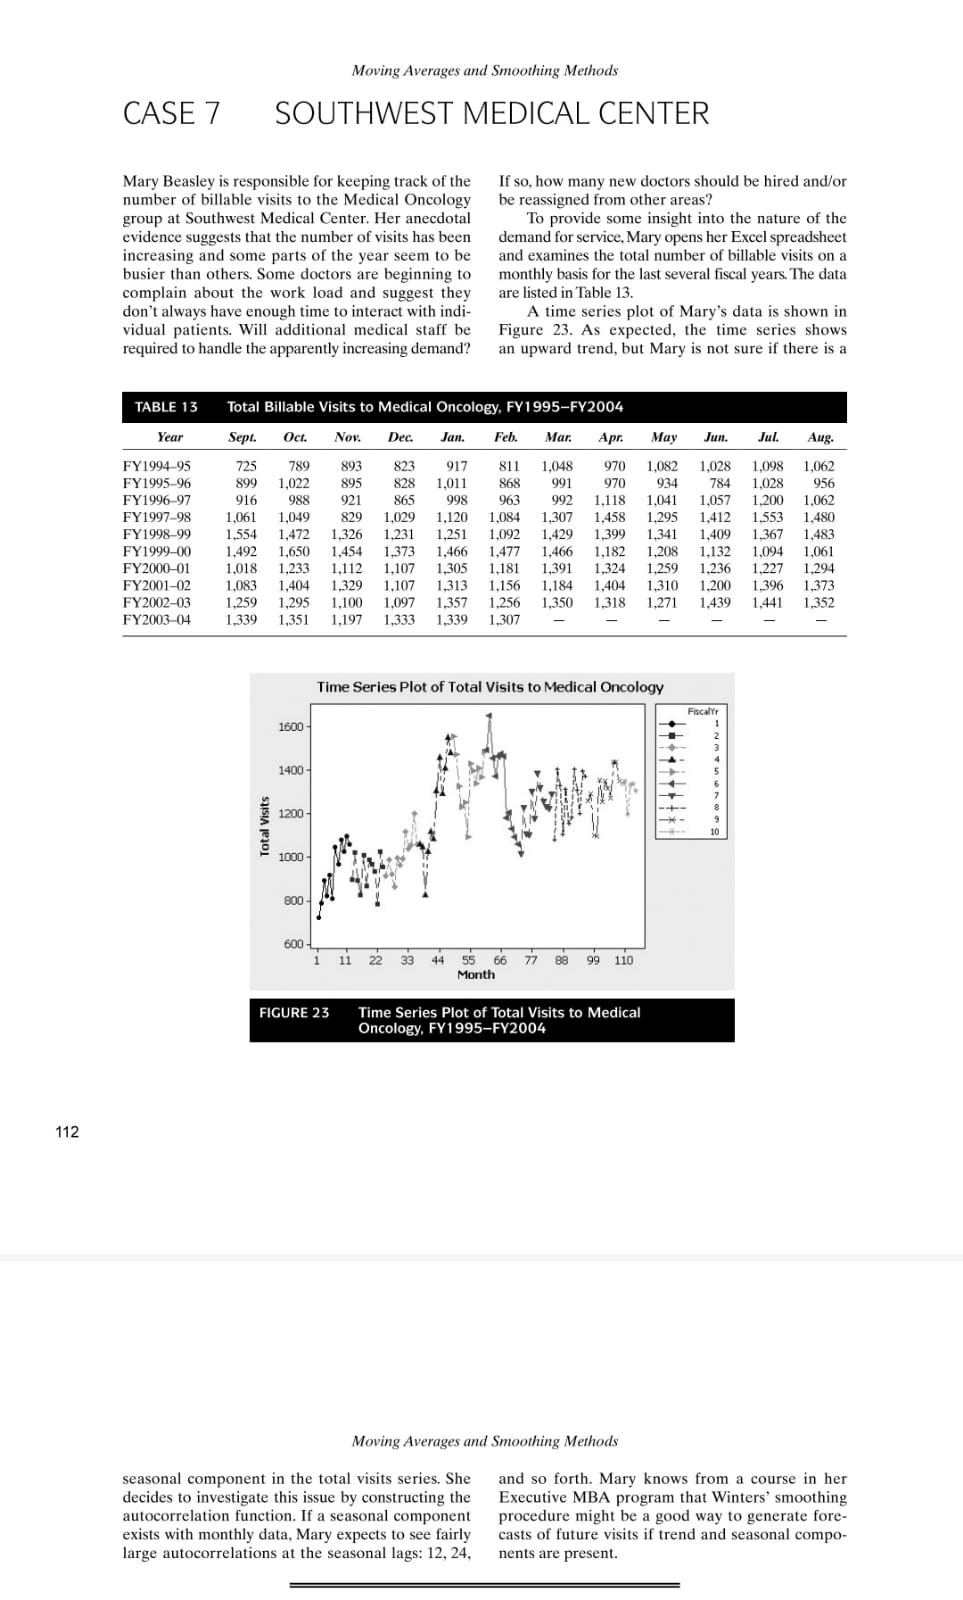
Moving Averages and Smoothing Methods CASE 7 SOUTHWEST MEDICAL CENTER Mary Beasley is responsible for keeping track of the number of billable visits to the Medical Oncology If so, how many new doctors should be hired and/or be reassigned from other areas? group at Southwest Medical Center. Her anecdotal To provide some insight into the nature of the evidence suggests that the number of visits has been increasing and some parts of the year seem to be demand for service, Mary opens her Excel spreadsheet and examines the total number of billable visits on a busier than others. Some doctors are beginning to monthly basis for the last several fiscal years. The data complain about the work load and suggest they are listed in Table 13. don't always have enough time to interact with indi- A time series plot of Mary's data is shown in vidual patients. Will additional medical staff be Figure 23. As expected, the time series shows required to handle the apparently increasing demand? an upward trend, but Mary is not sure if there is a TABLE 13 Total Billable Visits to Medical Oncology, FY1995-FY2004 Year Sept. Oct. Nov. Dec. Jan. Feb Mar. Apr. May Jun. Jul Aug. FY1994-95 725 789 893 823 917 811 1.048 970 1.082 1.028 1.098 1,062 FY1995-96 899 1.022 895 828 1.011 868 991 970 934 784 1.028 956 FY1996-97 916 988 921 865 998 963 992 1,118 1,041 1,057 1.200 1,062 FY1997-98 1,06 1,049 829 1.029 1,120 1,084 1,307 1,458 1.295 1,412 1,553 1.480 FY1998-99 1,554 1,472 1,326 1,231 1.251 1.092 1.429 1,399 1.341 1,409 1.367 1.483 FY1999-00 1,492 1,650 1,454 1,373 1,466 1,477 1,466 1,182 1,208 1,132 1.094 1,061 FY2000-01 1,018 1,233 1,112 1,107 1,305 1,181 1,391 1,324 1,259 FY2001-02 1,236 1,227 1,294 1.083 1.404 1.329 1.107 1.313 1.156 1,184 1.404 1.310 1,200 1.396 1.373 FY2002-03 1.259 1,295 1,100 1,097 1,357 1.256 1.350 1,318 1,271 1.439 1,441 1,352 FY2003-04 1,339 1,351 1,197 1,333 1,339 1,307 Time Series Plot of Total Visits to Medical Oncology 1600 1400 Total Visits 1200 1000 800 600- 1 1 22 33 44 55 66 77 88 99 110 Month FIGURE 23 Time Series Plot of Total Visits to Medical Oncology, FY1995-FY2004 112 Moving Averages and Smoothing Methods seasonal component in the total visits series. She and so forth. Mary knows from a course in her decides to investigate this issue by constructing the Executive MBA program that Winters' smoothing autocorrelation function. If a seasonal component procedure might be a good way to generate fore- exists with monthly data, Mary expects to see fairly casts of future visits if trend and seasonal compo- large autocorrelations at the seasonal lags: 12, 24, nents are present
Step by Step Solution
There are 3 Steps involved in it

Get step-by-step solutions from verified subject matter experts