

Question: Analyze the below 2 banks using the decision tree format in the below example. Example data: Bank Analysis Analyze the balance sheets and income statements
Analyze the below 2 banks using the decision tree format in the below example.
Example data: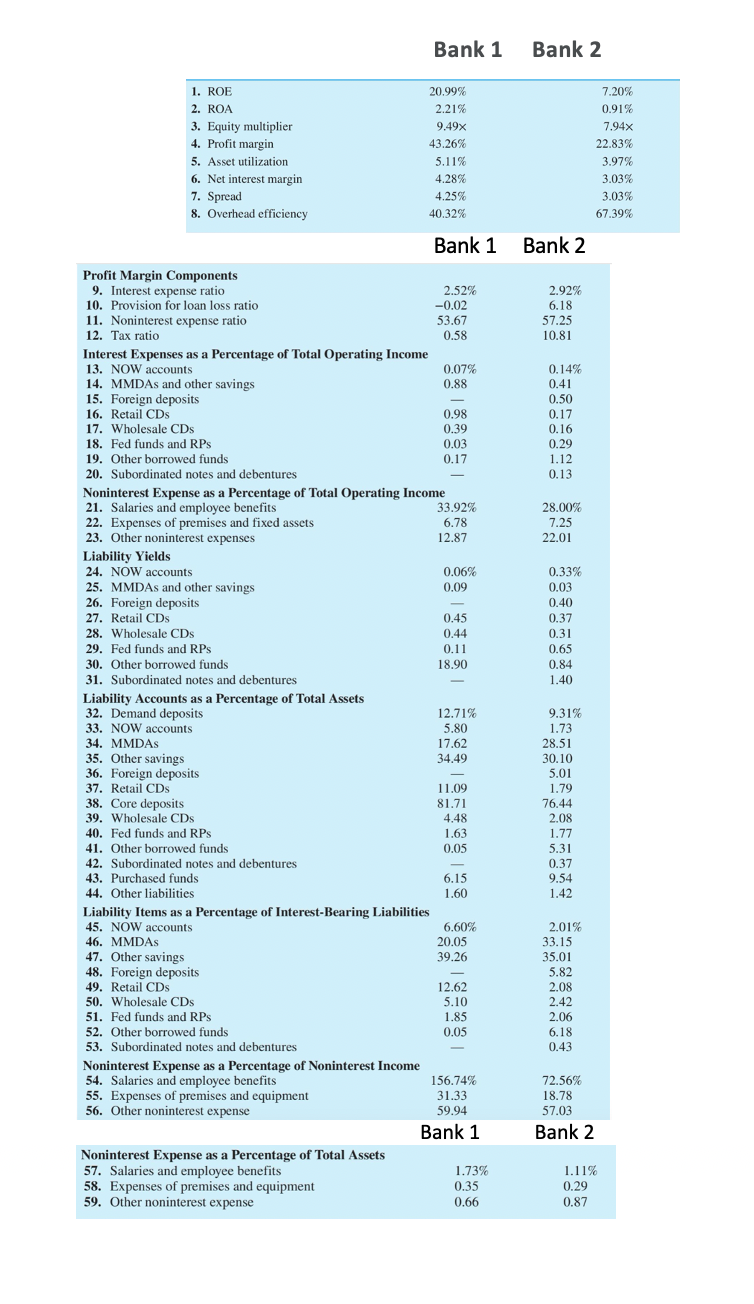
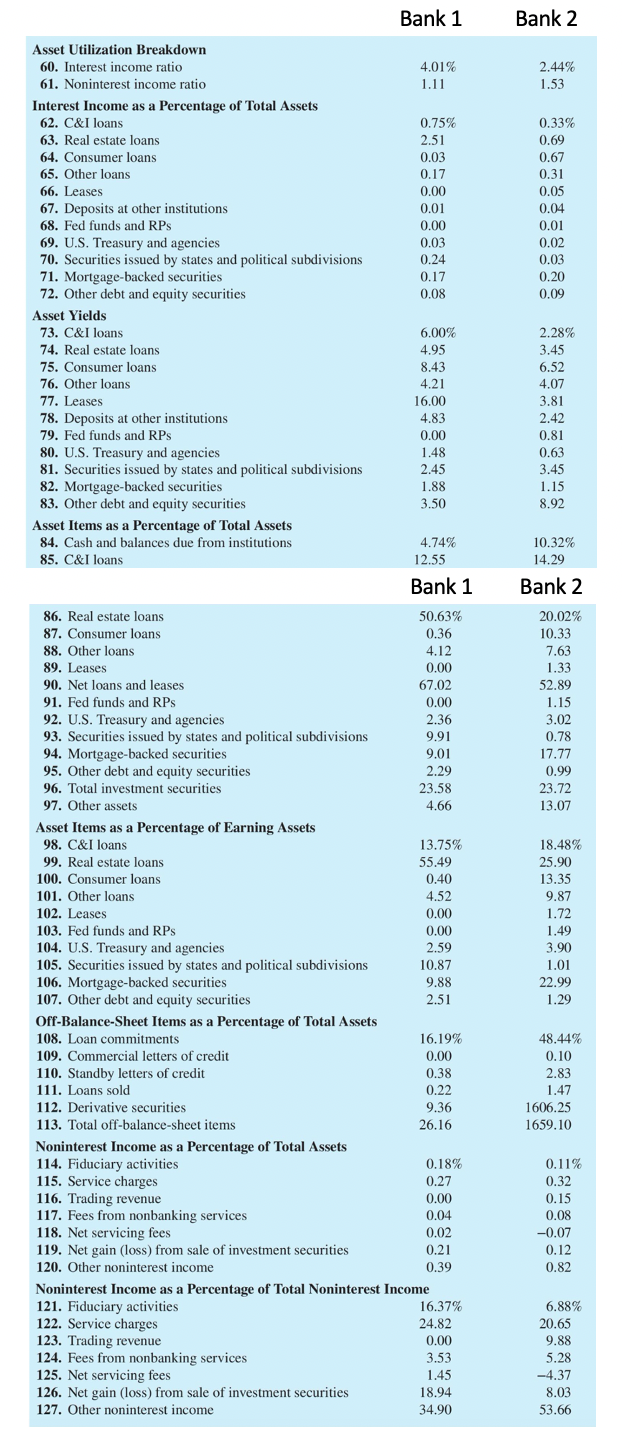
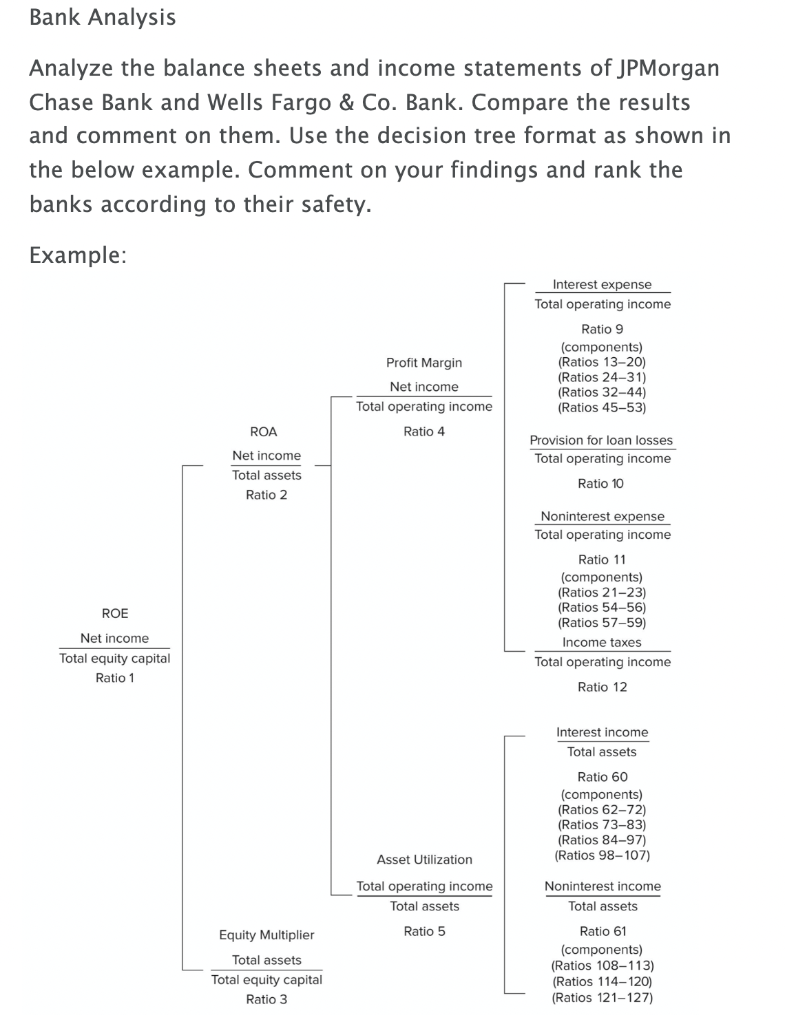
Bank Analysis Analyze the balance sheets and income statements of JPMorgan Chase Bank and Wells Fargo & Co. Bank. Compare the results and comment on them. Use the decision tree format as shown in the below example. Comment on your findings and rank the banks according to their safety. Example: Interest expense Total operating income Ratio 9 (components) (Ratios 13-20) (Ratios 24-31) (Ratios 32-44) (Ratios 45-53) Profit Margin Net income Total operating income Ratio 4 ROA Net income Total assets Ratio 2 Provision for loan losses Total operating income Ratio 10 Noninterest expense Total operating income Ratio 11 (components) (Ratios 21-23) (Ratios 54-56) (Ratios 57-59) Income taxes Total operating income ROE Net income Total equity capital Ratio 1 Ratio 12 Interest income Total assets Ratio 60 (components) (Ratios 62-72) (Ratios 73-83) (Ratios 84-97) (Ratios 98-107) Asset Utilization Total operating income Total assets Noninterest income Total assets Ratio 5 Equity Multiplier Total assets Total equity capital Ratio 3 Ratio 61 (components) (Ratios 108-113) (Ratios 114-120) (Ratios 121-127) Bank 1 Bank 2 1. ROE 2. ROA 3. Equity multiplier 4. Profit margin 5. Asset utilization 6. Net interest margin 7. Spread 8. Overhead efficiency 20.99% 2.21% 9.49x 43.26% 5.11% 4.28% 4.25% 40.32% 7.20% 0.91% 7.94x 22.83% 3.97% 3.03% 3.03% 67.39% Bank 1 Bank 2 2.92% 6.18 57.25 10.81 0.14% 0.41 0.50 0.17 0.16 0.29 1.12 0.13 Expenses 28.00% 7.25 22.01 0.06% 0.33% 0.03 0.40 0.37 0.31 0.65 0.84 1.40 Profit Margin Components 9. Interest expense ratio 2.52% 10. Provision for loan loss ratio -0.02 11. Noninterest expense ratio 53.67 12. Tax ratio 0.58 Interest Expenses as a Percentage of Total Operating Income 13. NOW accounts 0.07% 14. MMDAs and other savings 0.88 15. Foreign deposits 16. Retail CDs 0.98 17. Wholesale CDs 0.39 18. Fed funds and RPs 0.03 19. Other borrowed funds 0.17 20. Subordinated notes and debentures Noninterest Expense as a Percentage of Total Operating Income 21. Salaries and employee benefits 33.92% 22. of premises and fixed assets 6.78 23. Other noninterest expenses 12.87 Liability Yields 24. NOW accounts 25. MMDAs and other savings 0.09 26. Foreign deposits 27. Retail CDs 0.45 28. Wholesale CDs 0.44 29. Fed funds and RPs 0.11 30. Other borrowed funds 18.90 31. Subordinated notes and debentures Liability Accounts as a Percentage of Total Assets 32. Demand deposits 12.71% 33. NOW accounts 5.80 34. MMDAs 17.62 35. Other savings 34.49 36. Foreign deposits 37. Retail CDs 11.09 38. Core deposits 81.71 39. Wholesale CDs 4.48 40. Fed funds and RPS 1.63 41. Other borrowed funds 0.05 42. Subordinated notes and debentures 43. Purchased funds 6.15 44. Other liabilities 1.60 Liability Items as a Percentage of Interest-Bearing Liabilities 45. NOW accounts 6,60% 46. MMDAs 20.05 47. Other savings 39.26 48. Foreign deposits 49. Retail CDs 12.62 50. Wholesale CDs 5.10 51. Fed funds and RPS 1.85 52. Other borrowed funds 0.05 53. Subordinated notes and debentures Noninterest Expense as a Percentage of Noninterest Income 54. Salaries and employee benefits 156.74% 55. Expenses of premises and equipment 31.33 56. Other noninterest expense 59.94 Bank 1 Noninterest Expense as a Percentage of Total Assets 57. Salaries and employee benefits 1.73% 58. Expenses of premises and equipment 0.35 59. Other noninterest expense 0.66 9.31% 1.73 28.51 30.10 5.01 1.79 76.44 2.08 1.77 5.31 0.37 9.54 1.42 2.01% 33.15 35.01 5.82 2.08 2.42 2.06 6.18 0.43 72.56% 18.78 57.03 Bank 2 1.11% 0.29 0.87 Bank 2 2.44% 1.53 0.33% 0.69 0.67 0.31 0.05 0.04 0.01 0.02 0.03 0.20 0.09 2.28% 3.45 6.52 4.07 3.81 2.42 0.81 0.63 3.45 1.15 8.92 10.32% 14.29 Bank 2 Bank 1 Asset Utilization Breakdown 60. Interest income ratio 4.01% 61. Noninterest income ratio 1.11 Interest Income as a Percentage of Total Assets 62. C&I loans 0.75% 63. Real estate loans 2.51 64. Consumer loans 0.03 65. Other loans 0.17 66. Leases 0.00 67. Deposits at other institutions 0.01 68. Fed funds and RPs 0.00 69. U.S. Treasury and agencies 0.03 70. Securities issued by states and political subdivisions 0.24 71. Mortgage-backed securities 0.17 72. Other debt and equity securities 0.08 Asset Yields 73. C&I loans 6.00% 74. Real estate loans 4.95 75. Consumer loans 8.43 76. Other loans 4.21 77. Leases 16.00 78. Deposits at other institutions 4.83 79. Fed funds and RPS 0.00 80. U.S. Treasury and agencies 1.48 81. Securities issued by states and political subdivisions 2.45 82. Mortgage-backed securities 1.88 83. Other debt and equity securities 3.50 Asset Items as a Percentage of Total Assets 84. Cash and balances due from institutions 4.74% 85. C&I loans 12.55 Bank 1 86. Real estate loans 50.63% 87. Consumer loans 0.36 88. Other loans 4.12 89. Leases 0.00 90. Net loans and leases 67.02 91. Fed funds and RPs 0.00 92. U.S. Treasury and agencies 2.36 93. Securities issued by states and political subdivisions 9.91 94. Mortgage-backed securities 9.01 95. Other debt and equity securities 2.29 96. Total investment securities 23.58 97. Other assets 4.66 Asset Items as a Percentage of Earning Assets 98. C&I loans 13.75% 99. Real estate loans 55.49 100. Consumer loans 0.40 101. Other loans 4.52 102. Leases 103. Fed funds and RPS 0.00 104. U.S. Treasury and agencies 2.59 105. Securities issued by states and political subdivisions 10.87 106. Mortgage-backed securities 9.88 107. Other debt and equity securities 2.51 Off-Balance Sheet Items as a Percentage of Total Assets 108. Loan commitments 16.19% 109. Commercial letters of credit 0.00 110. Standby letters of credit 111. Loans sold 0.22 112. Derivative securities 9.36 113. Total off-balance-sheet items 26.16 Noninterest Income as a Percentage of Total Assets 114. Fiduciary activities 0.18% 115. Service charges 0.27 116. Trading revenue 0.00 117. Fees from nonbanking services 0.04 118. Net servicing fees 0.02 119. Net gain (loss) from sale of investment securities 0.21 120. Other noninterest income 0.39 Noninterest Income as a Percentage of Total Noninterest Income 121. Fiduciary activities 16,37% 122. Service charges 24.82 123. Trading revenue 0.00 124. Fees from nonbanking services 3.53 125. Net servicing fees 1.45 126. Net gain (loss) from sale of investment securities 18.94 127. Other noninterest income 34.90 20.02% 10.33 7.63 1.33 52.89 1.15 3.02 0.78 17.77 0.99 23.72 13.07 0.00 18.48% 25.90 13.35 9.87 1.72 1.49 3.90 1.01 22.99 1.29 0.38 48.44% 0.10 2.83 1.47 1606.25 1659.10 0.11% 0.32 0.15 0.08 -0.07 0.12 0.82 6.88% 20.65 9.88 5.28 -4.37 8.03 53.66
Step by Step Solution
There are 3 Steps involved in it

Get step-by-step solutions from verified subject matter experts