

Question: Analyze the cost data in the Excel workbook C08 Problem Data for the Costcutin Co. Create a chart to help you explain the results. What
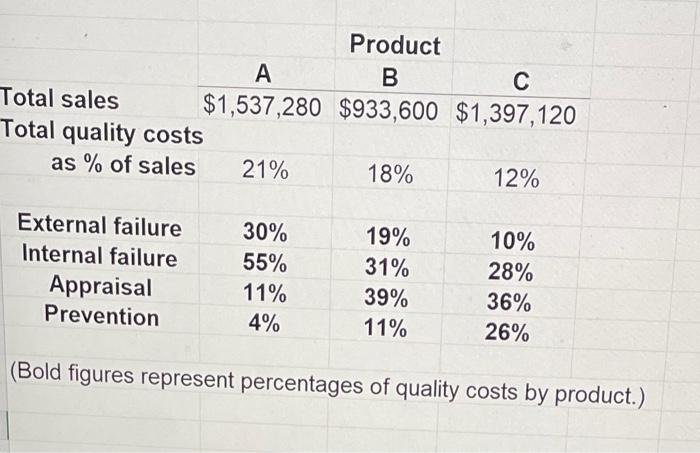
Analyze the cost data in the Excel workbook C08 Problem Data for the Costcutin Co. Create a chart to help you explain the results. What are the implications of these data for management? (Bold figures represent percentages of quality costs by product.)
Step by Step Solution
There are 3 Steps involved in it
1 Expert Approved Answer
Step: 1 Unlock

Question Has Been Solved by an Expert!
Get step-by-step solutions from verified subject matter experts
Step: 2 Unlock
Step: 3 Unlock