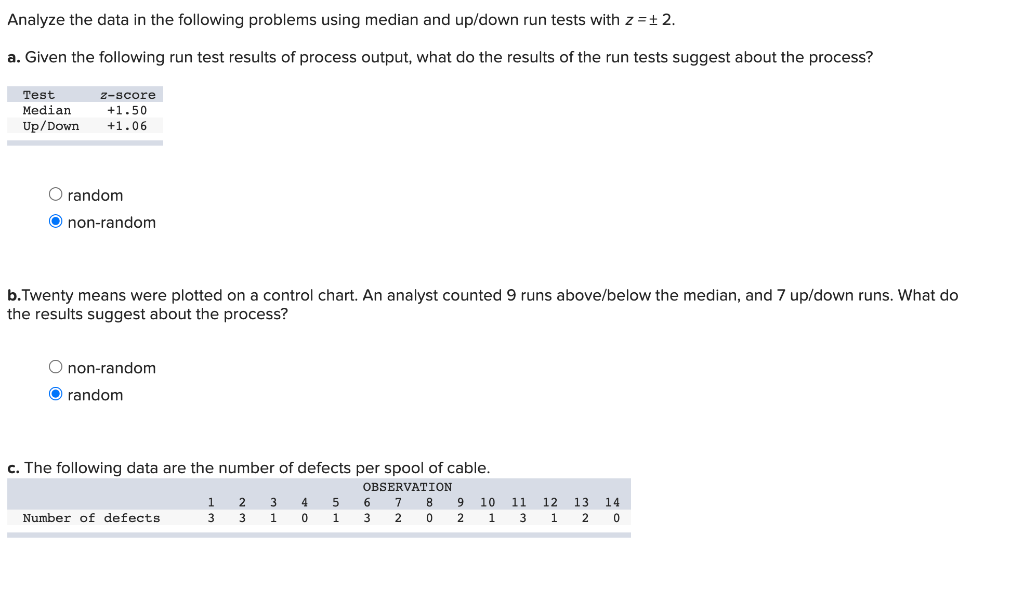
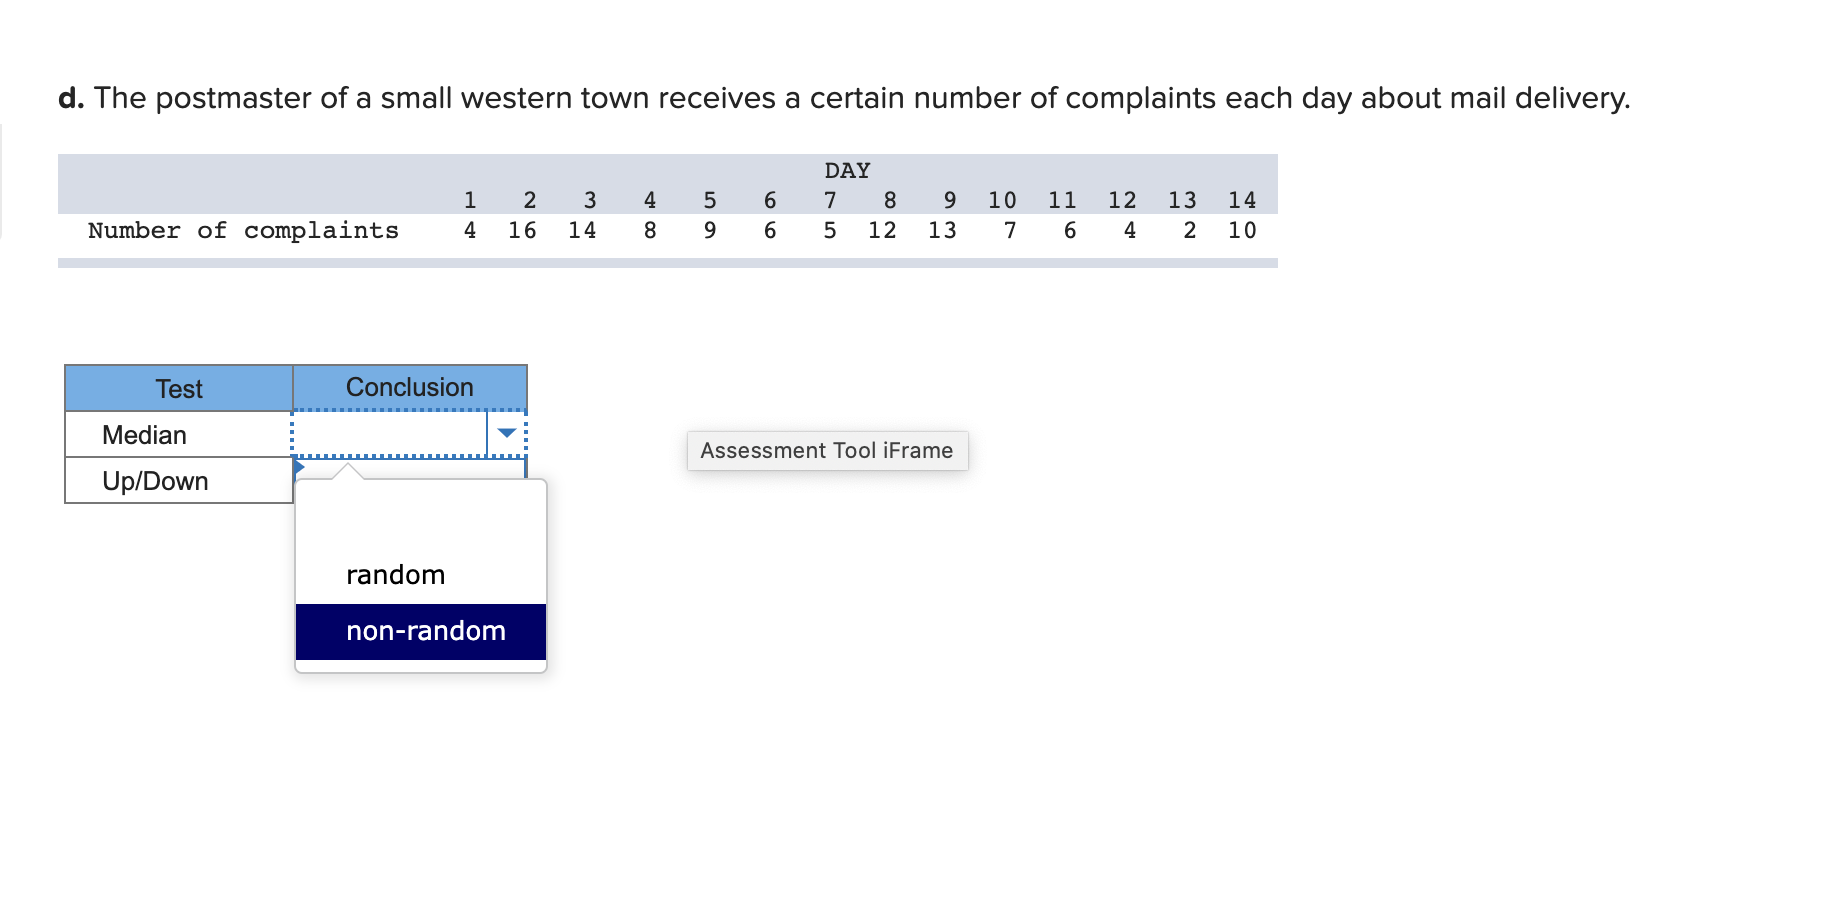
Question: Analyze the data in the following problems using median and up/down run tests with z=+ 2. a. Given the following run test results of process

Analyze the data in the following problems usingAnalyze the data in the following problems using

Analyze the data in the following problems using median and up/down run tests with z=+ 2. a. Given the following run test results of process output, what do the results of the run tests suggest about the process? Test Median Up/Down z-score +1.50 +1.06 O random O non-random b.Twenty means were plotted on a control chart. An analyst counted 9 runs above/below the median, and 7 up/down runs. What do the results suggest about the process? O non-random O random c. The following data are the number of defects per spool of cable. OBSERVATION 1 5 2 3 3 1 4 0 6 3 7 2 8 0 9 2 10 1 11 12 3 1 13 2 14 0 Number of defects 3 1 d. The postmaster of a small western town receives a certain number of complaints each day about mail delivery. 4 5 6 1 4 10 2 16 3 14 DAY 7 8 5 12 NOO 9 13 am 11 6 12 4 AN 13 2 14 10 Number of complaints 8 9 6 7 Test Conclusion Median Assessment Tool iFrame Up/Down random non-random

Step by Step Solution

There are 3 Steps involved in it

1 Expert Approved Answer
Step: 1 Unlock blur-text-image
Question Has Been Solved by an Expert!

Get step-by-step solutions from verified subject matter experts

Step: 2 Unlock
Step: 3 Unlock

Students Have Also Explored These Related General Management Questions!