

Question: Run test problem should be using data from problem 8 4. Software upgrade times (in minutes) are being evaluated. Samples of five observations each have
Run test problem should be using data from problem 8
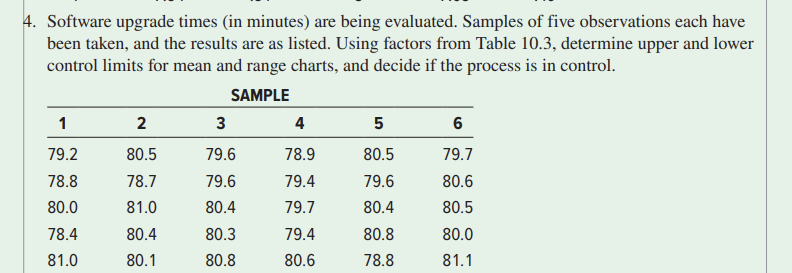
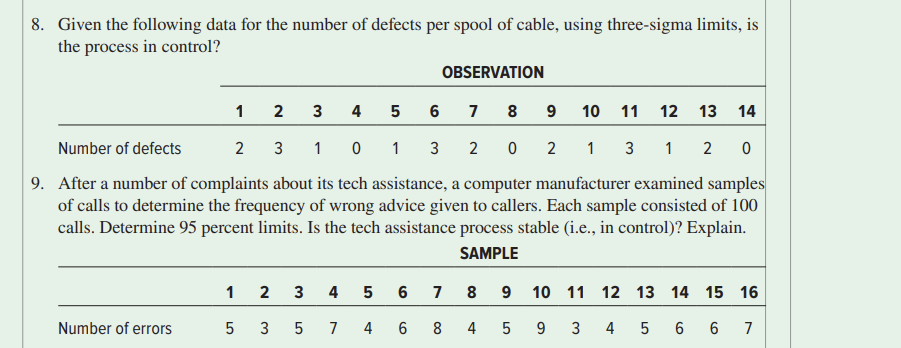
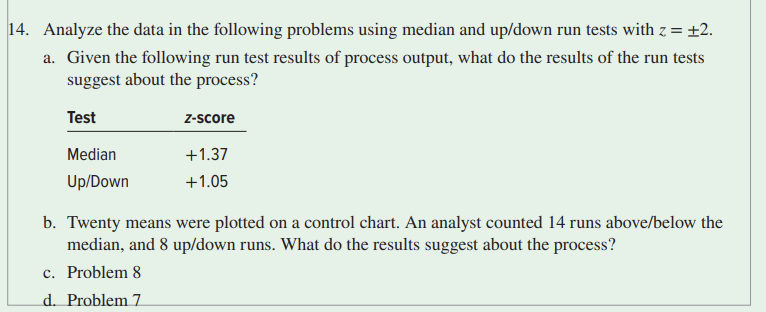
4. Software upgrade times (in minutes) are being evaluated. Samples of five observations each have been taken, and the results are as listed. Using factors from Table 10.3, determine upper and lower control limits for mean and range charts, and decide if the process is in control. SAMPLE 1 2 3 4 5 6 79.2 80.5 79.6 78.9 80.5 79.7 78.8 78.7 79.6 79.4 79.6 80.6 80.0 81.0 80.4 79.7 80.4 80.5 78.4 80.4 80.3 79.4 80.8 80.0 81.0 80.1 80.8 80.6 78.8 81.1 8. Given the following data for the number of defects per spool of cable, using three-sigma limits, is the process in control? OBSERVATION N 3 2 3 1 4 5 6 7 8 9 10 11 12 13 14 Number of defects 2 3 1 0 1 3 2 0 2 1 3 1 2 0 9. After a number of complaints about its tech assistance, a computer manufacturer examined samples of calls to determine the frequency of wrong advice given to callers. Each sample consisted of 100 calls. Determine 95 percent limits. Is the tech assistance process stable (i.e., in control)? Explain. SAMPLE 1 2 3 4 5 6 7 8 8 9 10 11 12 13 14 15 16 Number of errors 5 3 5 7 4 6 8 4 5 5 9 9 3 4 5 6 6 7 14. Analyze the data in the following problems using median and up/down run tests with z = +2. a. Given the following run test results of process output, what do the results of the run tests suggest about the process? Test z-score Median Up/Down +1.37 +1.05 b. Twenty means were plotted on a control chart. An analyst counted 14 runs above/below the median, and 8 up/down runs. What do the results suggest about the process? c. Problem 8 d. Problem 7Step by Step Solution
There are 3 Steps involved in it
1 Expert Approved Answer
Step: 1 Unlock

Question Has Been Solved by an Expert!
Get step-by-step solutions from verified subject matter experts
Step: 2 Unlock
Step: 3 Unlock