

Question: analyze the Return on equity, Return on assets and Net profit margin of Coles and Woolworth from 2021 to 2022 based on the data in
analyze the Return on equity, Return on assets and Net profit margin of Coles and Woolworth from 2021 to 2022 based on the data in the chart.
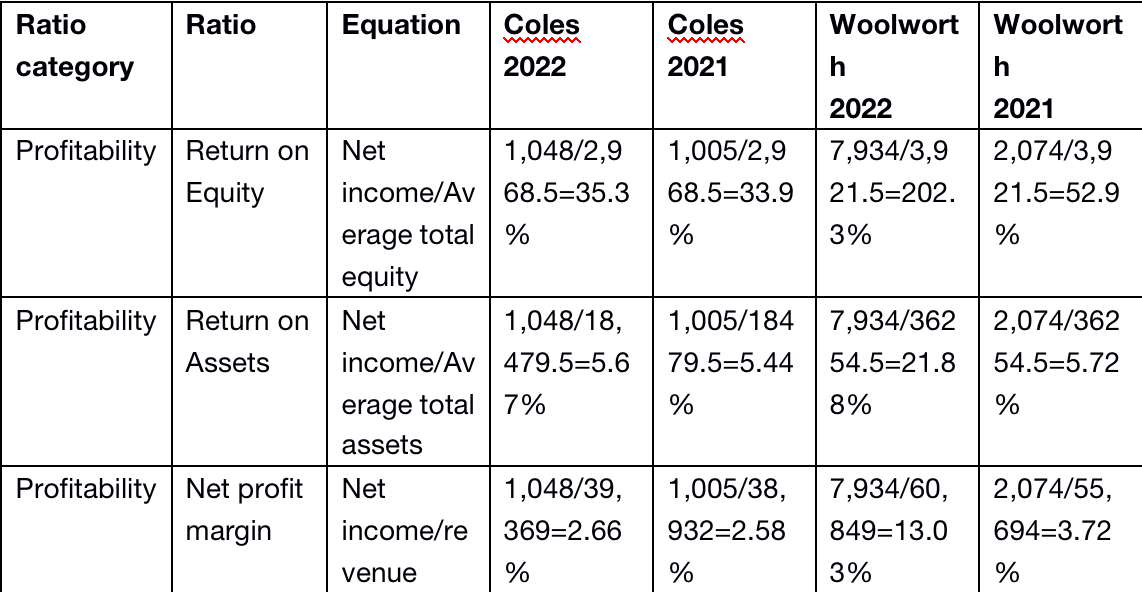
Ratio Ratio Equation Coles Coles Woolwort Woolwort category 2022 2021 h h 2022 2021 Profitability Return on Net Equity 1,048/2,9 1,005/2,9 7,934/3,9 2,074/3,9 income/Av 68.5=35.3 68.5=33.9 21.5=202. 21.5=52.9 erage total % % 3% % equity Profitability Return on Net 1,048/18, 1,005/184 7,934/362 2,074/362 Assets income/Av 479.5=5.6 79.5=5.44 54.5=21.8 54.5=5.72 erage total 7% % 8% % assets Profitability Net profit Net 1,048/39, 1,005/38, 7,934/60, 2,074/55, margin income/re 369=2.66 932=2.58 849=13.0 694-3.72 venue % % 3% % Ratio Ratio Equation Coles Coles Woolwort Woolwort category 2022 2021 h h 2022 2021 Profitability Return on Net Equity 1,048/2,9 1,005/2,9 7,934/3,9 2,074/3,9 income/Av 68.5=35.3 68.5=33.9 21.5=202. 21.5=52.9 erage total % % 3% % equity Profitability Return on Net 1,048/18, 1,005/184 7,934/362 2,074/362 Assets income/Av 479.5=5.6 79.5=5.44 54.5=21.8 54.5=5.72 erage total 7% % 8% % assets Profitability Net profit Net 1,048/39, 1,005/38, 7,934/60, 2,074/55, margin income/re 369=2.66 932=2.58 849=13.0 694-3.72 venue % % 3% %
Step by Step Solution
There are 3 Steps involved in it
Solution Based on the data provided in the chart we can calculate the Return on ... View full answer

Get step-by-step solutions from verified subject matter experts