

Question: Analyze the scatterplot to explain the most likely transformation necessary to linearize the data? Dashboard | Khan Acad X _> Slides - Membranes: P4 x
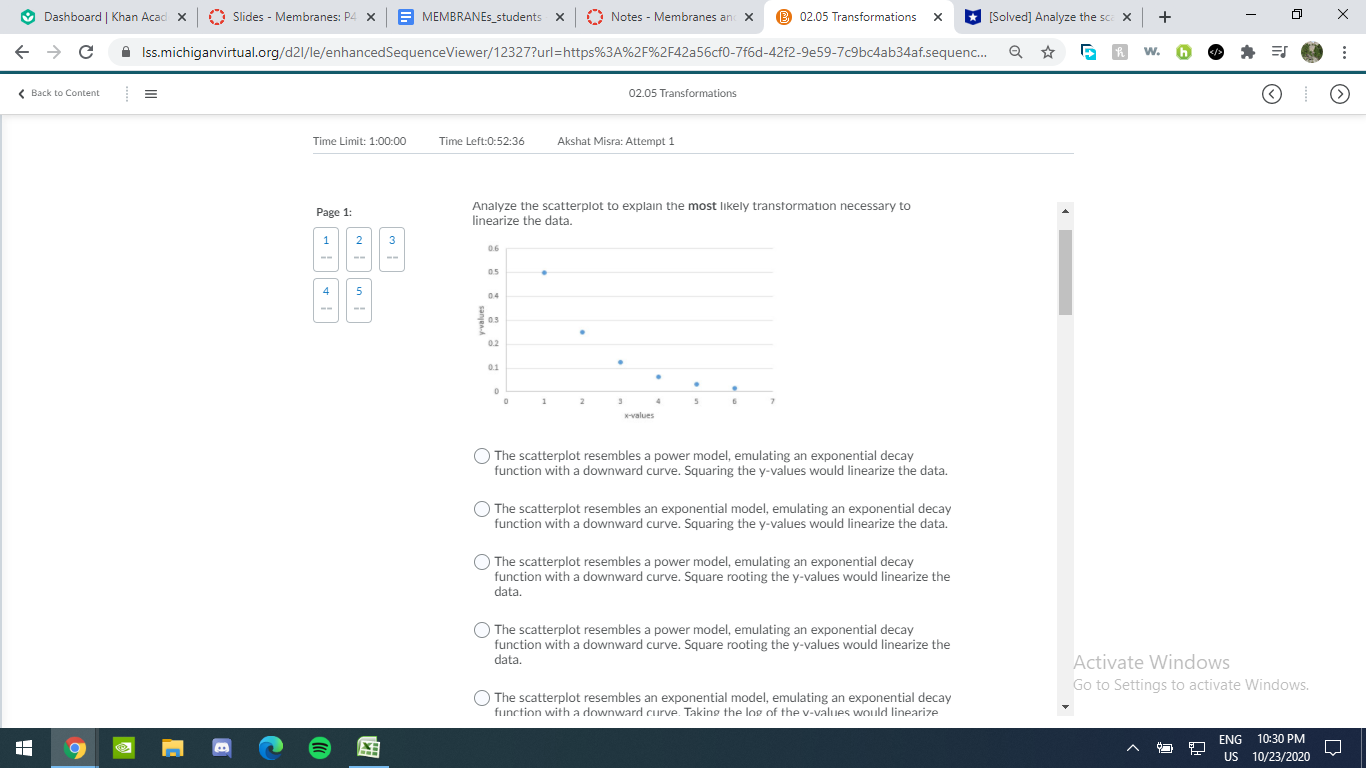
Analyze the scatterplot to explain the most likely transformation necessary to linearize the data?
Dashboard | Khan Acad X _> Slides - Membranes: P4 x _ MEMBRANEs_students x Notes - Membranes an( X 8 02.05 Transformations x * [Solved] Analyze the scc X + 07 X C A Iss.michiganvirtual.org/d21/le/enhancedSequenceViewer/12327?url=https%3A%2F%2F42a56cf0-7f6d-42f2-9e59-7c9bc4ab34af.sequence.. Back to Content 02.05 Transformations (
Step by Step Solution
There are 3 Steps involved in it
1 Expert Approved Answer
Step: 1 Unlock

Question Has Been Solved by an Expert!
Get step-by-step solutions from verified subject matter experts
Step: 2 Unlock
Step: 3 Unlock