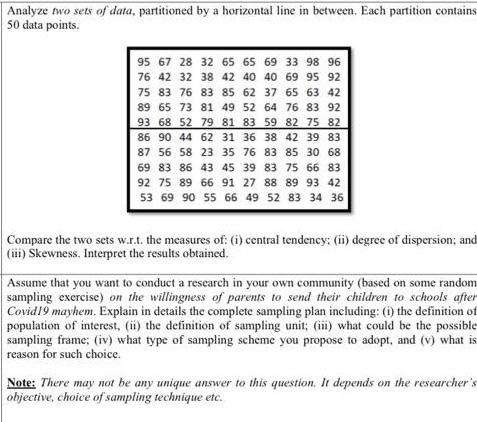
Question: Analyze two sets of data, partitioned by a horizontal line in between. Each partition contains 50 data points. 95 67 28 32 65 65 69

Analyze two sets of data, partitioned by a
Analyze two sets of data, partitioned by a horizontal line in between. Each partition contains 50 data points. 95 67 28 32 65 65 69 33 98 96 76 42 32 38 42 40 40 69 95 92 75 83 76 83 85 62 37 65 63 42 89 65 73 81 49 52 64 76 83 92 93 68 52 79 81 83 59 82 75 82 86 90 44 62 31 36 38 42 39 83 87 56 58 23 35 76 83 85 30 68 69 83 86 43 45 39 83 75 66 83 92 75 89 66 91 27 88 89 93 42 53 69 90 55 66 49 52 83 34 36 Compare the two sets w...t. the measures of: (i) central tendency: (ii) degree of dispersion: and (iii) Skewness. Interpret the results obtained. Assume that you want to conduct a research in your own community (based on some random sampling exercise) on the willingness of parents to send their children to schools after Covid19 mayhem. Explain in details the complete sampling plan including: 0) the definition of population of interest, (ii) the definition of sampling unit; (iii) what could be the possible sampling frame; (iv) what type of sampling scheme you propose to adopt, and (v) what is reason for such choice. Note: There may not be any unique answer to this question. It depends on the researchers objective, choice of sampling technique etc

Step by Step Solution

There are 3 Steps involved in it

1 Expert Approved Answer
Step: 1 Unlock blur-text-image
Question Has Been Solved by an Expert!

Get step-by-step solutions from verified subject matter experts

Step: 2 Unlock
Step: 3 Unlock

Students Have Also Explored These Related General Management Questions!