

Question: Analyzing Financial Risk Presented below are summary financial data from the General Electric Company 2015 annual report. Using the ratio definitions from Exhibit 4.6, calculate
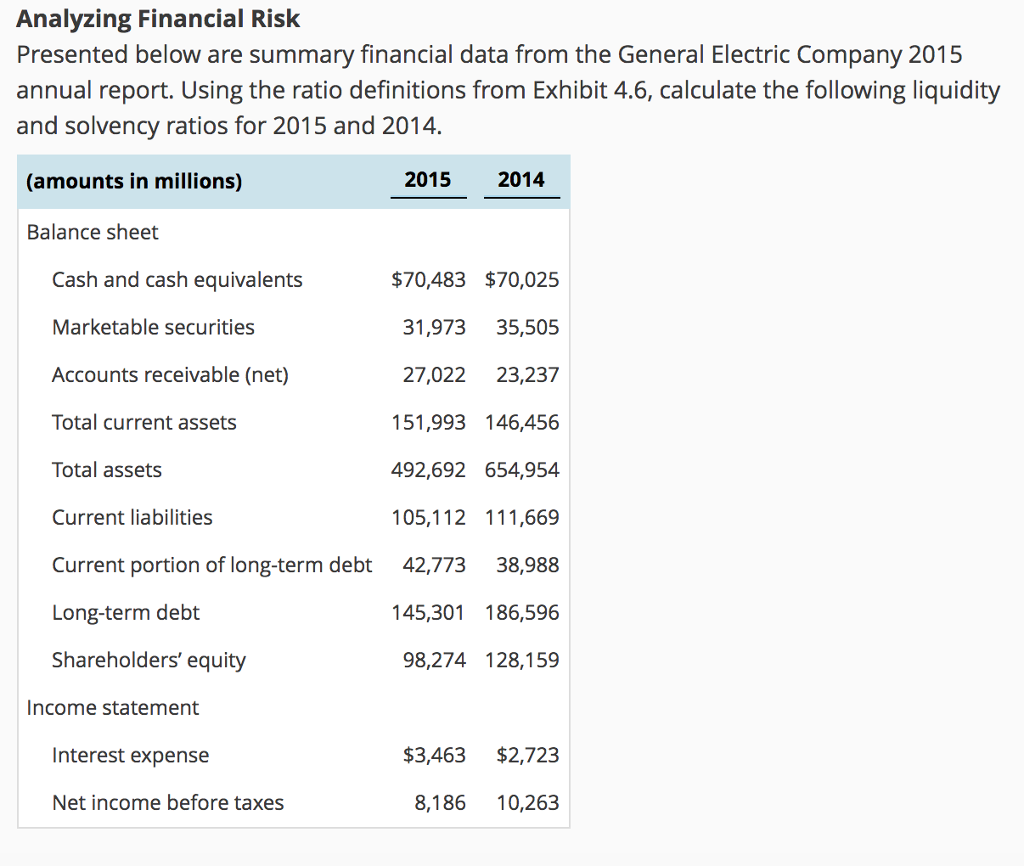
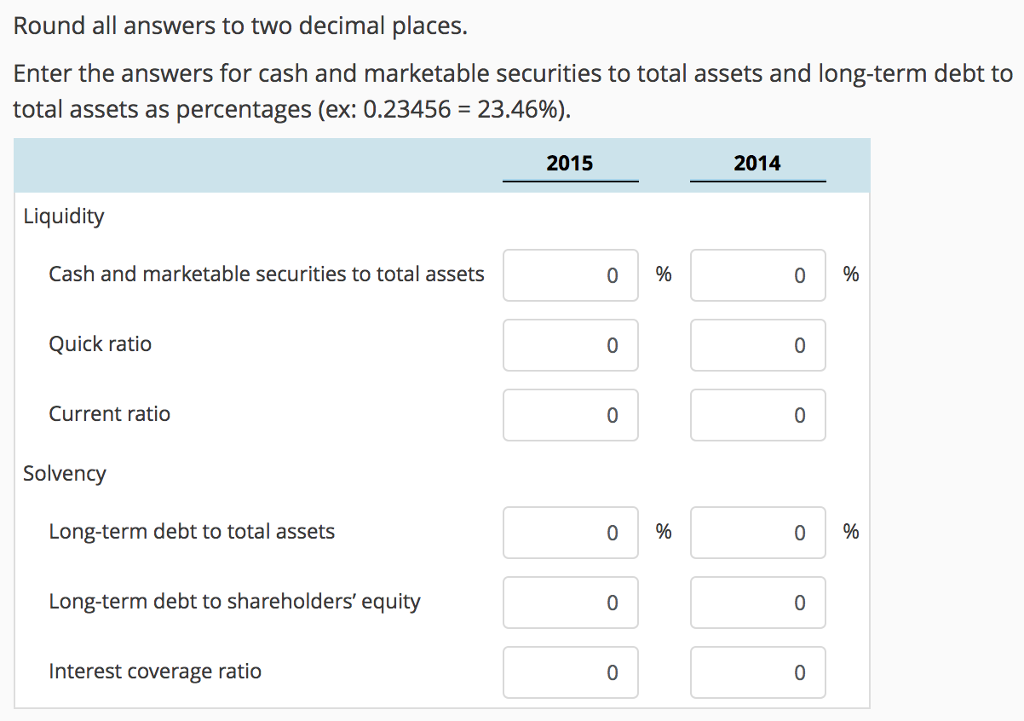
Analyzing Financial Risk Presented below are summary financial data from the General Electric Company 2015 annual report. Using the ratio definitions from Exhibit 4.6, calculate the following liquidity and solvency ratios for 2015 and 2014. (amounts in millions) Balance sheet 2015 2014 Cash and cash equivalents Marketable securities Accounts receivable (net) Total current assets Total assets Current liabilities Current portion of long-term debt 42,773 38,988 Long-term debt Shareholders' equity $70,483 $70,025 31,973 35,505 27,022 23,237 151,993 146,456 492,692 654,954 105,112 111,669 145,301 186,596 98,274 128,159 Income statement Interest expense $3,463 $2,723 Net income before taxes 8,186 10,263
Step by Step Solution
There are 3 Steps involved in it

Get step-by-step solutions from verified subject matter experts