

Question: ANNUAL Expected Returns, Standard Deviations, and Correlations Risk-Free Rate 3% Asset Class Expected Return Std. Deviation Large Stocks Small Stocks Sharpe Ratio Large Stocks Small
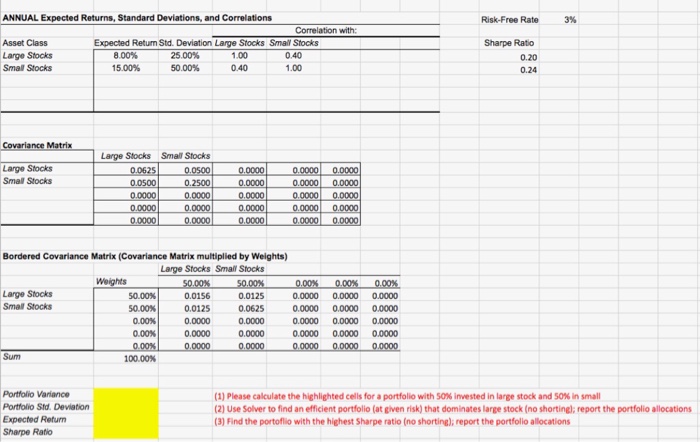
ANNUAL Expected Returns, Standard Deviations, and Correlations Risk-Free Rate 3% Asset Class Expected Return Std. Deviation Large Stocks Small Stocks Sharpe Ratio Large Stocks Small Stocks 800% 15.00% 25 00% 50.00% 0.40 1.00 1.00 0.20 0.24 0.40 Large Stocks Small Stocks Large Stocks Small Stocks Bordered Covariance Matrix (Covariance Matrix multiplied by Weights) Large Stocks Small Stocks Large Stocks Small Stocks 50.00% 50.00% 0.00% 0.00% 0.0156 0.0125 0.0000 0.0000 0.0125 0.0625 0.0000 0.0000 0.0000 0.0000 00000 .00000.0000 0.0000 0.00000.0000 0.0000 0.0000 0.0000 0.0000 Sum 100.00% Portfolio Variance Portfolio Std. Deviation Expected Refurn Sharpe Ratio (1) Please calculate the highlighted cells for a portfolio with 50% invested in large stock and 50% in small (2) Use Solver to find an efficient portfolio (at given risk) that dominates large stock (no shortingl; report the portfolio allocations (3) Find the portoflio with the highest Sharpe ratio (no shorting), report the portfolio allocations
Step by Step Solution
There are 3 Steps involved in it

Get step-by-step solutions from verified subject matter experts