

Question: Please provide a step by step on how to use solver on excel. For #2 & #3 in red ANNUAL Expected Returns, Standard Deviations, and
Please provide a step by step on how to use solver on excel. For #2 & #3 in red
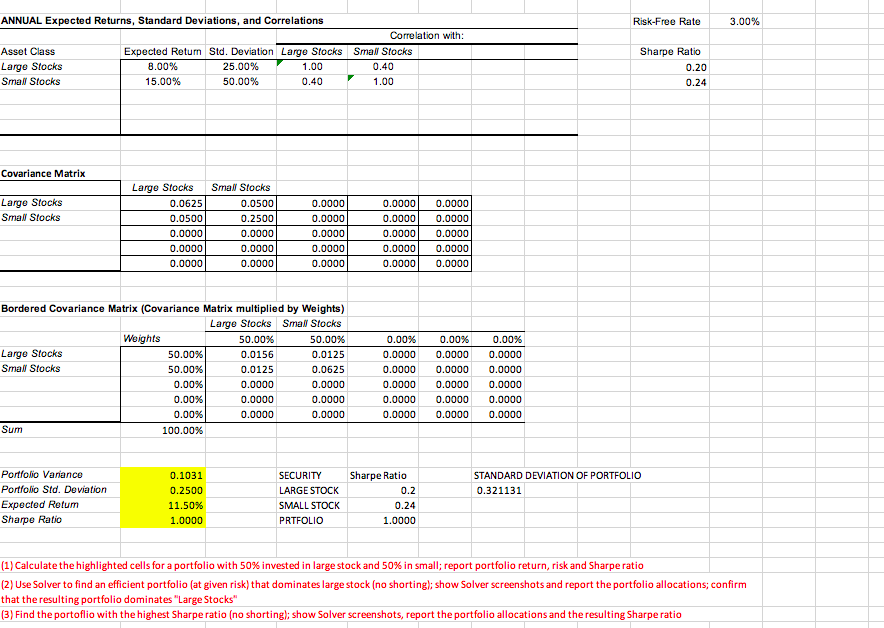
ANNUAL Expected Returns, Standard Deviations, and Correlations Risk-Free Rate 3.00% Correlation with Sharpe Ratio Asset Class Large Stocks Sma Stocks Expected Retun Std. Deviation Large Stocks Sma Stocks 8.00% 15.00% 25.00% 50.00% 1.00 0.40 0.40 1.00 0.20 0.24 Covariance Matrix Large Stocks Sma Stocks Large Stocks Sma Stocks 0.0625 0.0500 0.0000 0.0000 0.0000 0.0500 0.2500 0.0000 0.0000 0.0000 0.0000 0.0000 0.0000 0.0000 0.0000 0.0000 0.0000 0.0000 0.0000 0.0000 0.0000 0.0000 0.0000 0.0000 0.0000 Bordered Covariance Matrix (Covariance Matrix multiplied by Weights) Large Stocks Smal Stocks 50.00% 0.0125 0.0625 0.0000 0.0000 0.0000 Weights 50.00% 0.0156 0.0125 0.0000 0.0000 0.0000 0.00% 0.0000 0.0000 0.0000 0.0000 0.0000 0.0000 0.0000 0.0000 0.0000 0.0000 0.0000 0.0000 0.0000 0.0000 0.0000 0.00% 0.00% Large Stocks Sma Stocks 50.00% 50.00% 0.00% 0.00% 0.00% 100.00% Sum Portfolio Variance Portfolio Std. Deviation Expected Retunm Sharpe Ratio 0.1031 0.2500 11.50% 1.0000 Sharpe Ratio SECURITY LARGE STOCK SMALL STOCK PRTFOLIO STANDARD DEVIATION OF PORTFOLIO 0.321131 0.2 0.24 1.0000 (1) Calculate the highlighted cells for a portfolio with 50% invested in large stock and 50% in small; report portfolio return, risk and Sharpe ratio (2) Use Solver to find an efficient portfolio (at given risk) that dominates largestock (no shortingl; show Solver screenshots and report the portfolio allocations; confirm that the resulting portfolio dominates "Large Stocks" (3) Find the portoflio with the highest Sharpe ratio (no shortingl; show Solver screenshots, report the portfolio allocations and the resulting Sharpe ratio ANNUAL Expected Returns, Standard Deviations, and Correlations Risk-Free Rate 3.00% Correlation with Sharpe Ratio Asset Class Large Stocks Sma Stocks Expected Retun Std. Deviation Large Stocks Sma Stocks 8.00% 15.00% 25.00% 50.00% 1.00 0.40 0.40 1.00 0.20 0.24 Covariance Matrix Large Stocks Sma Stocks Large Stocks Sma Stocks 0.0625 0.0500 0.0000 0.0000 0.0000 0.0500 0.2500 0.0000 0.0000 0.0000 0.0000 0.0000 0.0000 0.0000 0.0000 0.0000 0.0000 0.0000 0.0000 0.0000 0.0000 0.0000 0.0000 0.0000 0.0000 Bordered Covariance Matrix (Covariance Matrix multiplied by Weights) Large Stocks Smal Stocks 50.00% 0.0125 0.0625 0.0000 0.0000 0.0000 Weights 50.00% 0.0156 0.0125 0.0000 0.0000 0.0000 0.00% 0.0000 0.0000 0.0000 0.0000 0.0000 0.0000 0.0000 0.0000 0.0000 0.0000 0.0000 0.0000 0.0000 0.0000 0.0000 0.00% 0.00% Large Stocks Sma Stocks 50.00% 50.00% 0.00% 0.00% 0.00% 100.00% Sum Portfolio Variance Portfolio Std. Deviation Expected Retunm Sharpe Ratio 0.1031 0.2500 11.50% 1.0000 Sharpe Ratio SECURITY LARGE STOCK SMALL STOCK PRTFOLIO STANDARD DEVIATION OF PORTFOLIO 0.321131 0.2 0.24 1.0000 (1) Calculate the highlighted cells for a portfolio with 50% invested in large stock and 50% in small; report portfolio return, risk and Sharpe ratio (2) Use Solver to find an efficient portfolio (at given risk) that dominates largestock (no shortingl; show Solver screenshots and report the portfolio allocations; confirm that the resulting portfolio dominates "Large Stocks" (3) Find the portoflio with the highest Sharpe ratio (no shortingl; show Solver screenshots, report the portfolio allocations and the resulting Sharpe ratio
Step by Step Solution
There are 3 Steps involved in it

Get step-by-step solutions from verified subject matter experts