

Question: Answer.... 2. Compute each of the indicated numerical summaries for the data above and enter the results in the table below. The mean and standard

Answer....
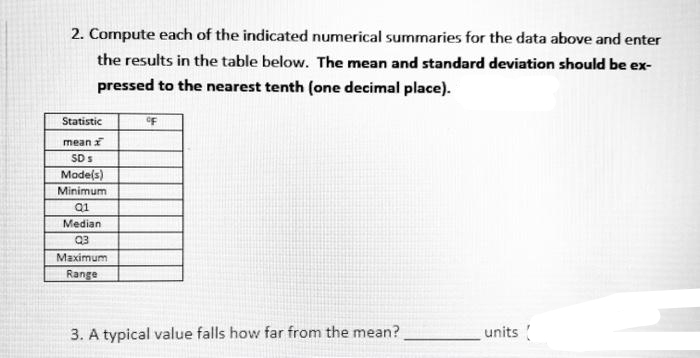
2. Compute each of the indicated numerical summaries for the data above and enter the results in the table below. The mean and standard deviation should be ex- pressed to the nearest tenth (one decimal place). Statistic mean SD S Mode(s) Minimum 01 Median Maximum Range 3. A typical value falls how far from the mean? units
Step by Step Solution
There are 3 Steps involved in it
1 Expert Approved Answer
Step: 1 Unlock

Question Has Been Solved by an Expert!
Get step-by-step solutions from verified subject matter experts
Step: 2 Unlock
Step: 3 Unlock