

Question: answer 4. A graph appears below showing the number of adults and children who prefer each type of soda. There were 130 adults and kids
answer
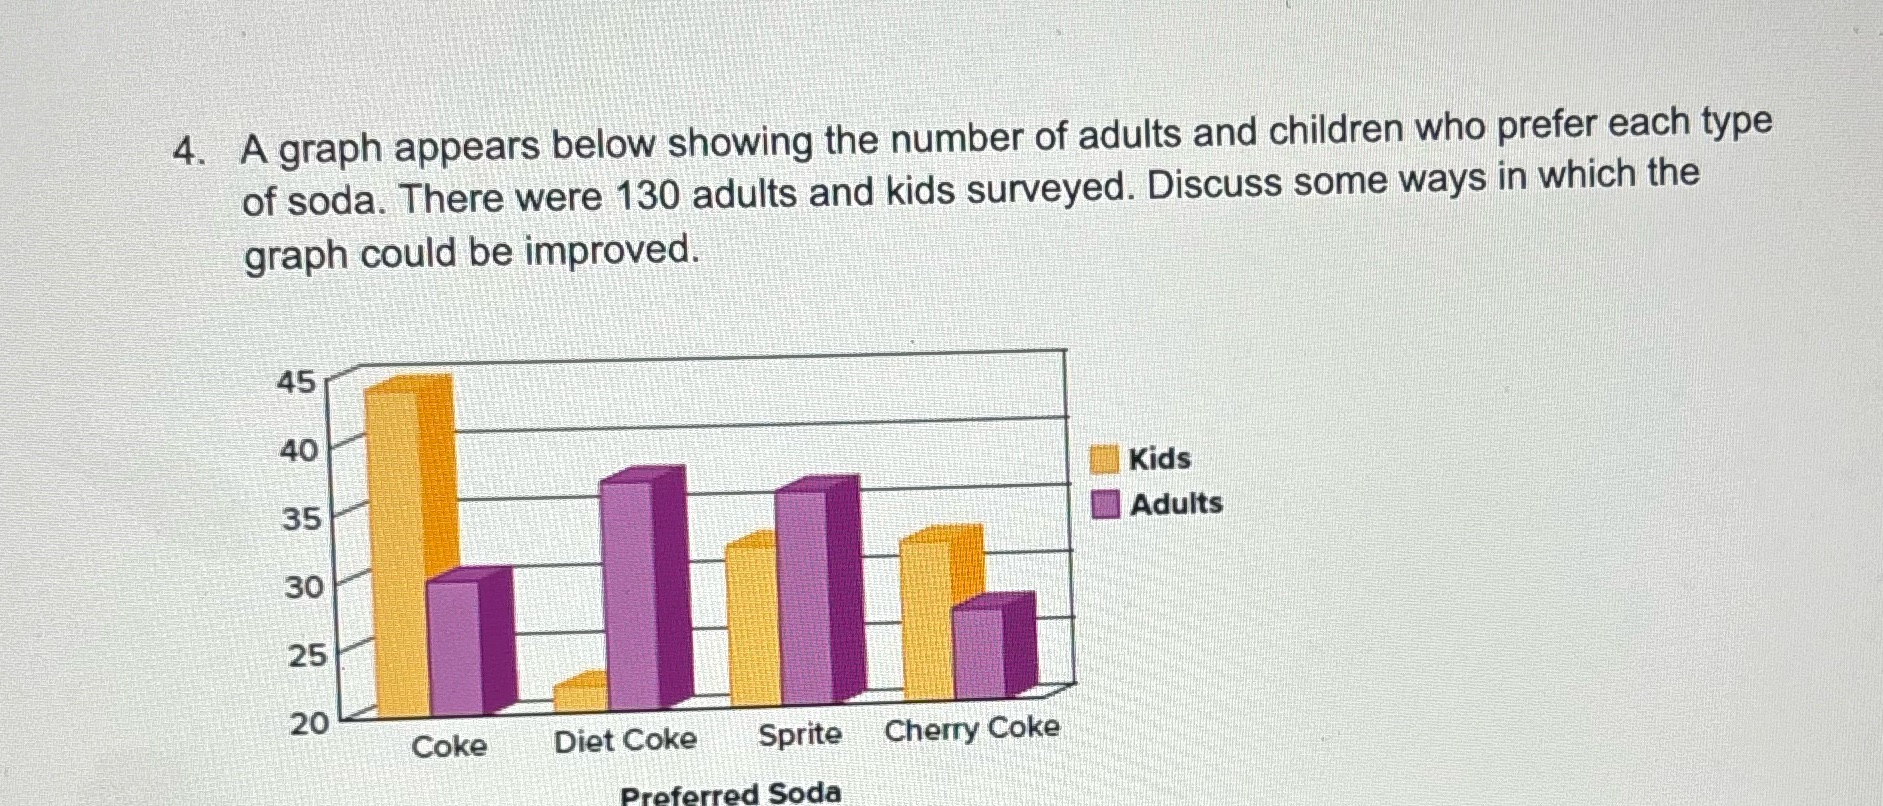
4. A graph appears below showing the number of adults and children who prefer each type of soda. There were 130 adults and kids surveyed. Discuss some ways in which the graph could be improved. Kids @ Adults Coke Diet Cok Sprite Cherry Coke Preferred Soda 20
Step by Step Solution
There are 3 Steps involved in it
1 Expert Approved Answer
Step: 1 Unlock

Question Has Been Solved by an Expert!
Get step-by-step solutions from verified subject matter experts
Step: 2 Unlock
Step: 3 Unlock