

Question: Answer A and B. Please do this on EXCEL, kindly USE A SOLVER. a lso attach a screenshot of the CELLS, PARAMETERS, SOLVER ETC. and
Answer A and B. Please do this on EXCEL, kindly USE A SOLVER. also attach a screenshot of the CELLS, PARAMETERS, SOLVER ETC. and explain how you got the answer and conclusion. Thank you
EXCEL AND SOLVER!!!!!
EXCEL AND SOLVER!!!
Answer A and B. Please do this on EXCEL, kindly USE A SOLVER. also attach a screenshot of the CELLS, PARAMETERS, SOLVER ETC. and explain how you got the answer and conclusion. Thank you
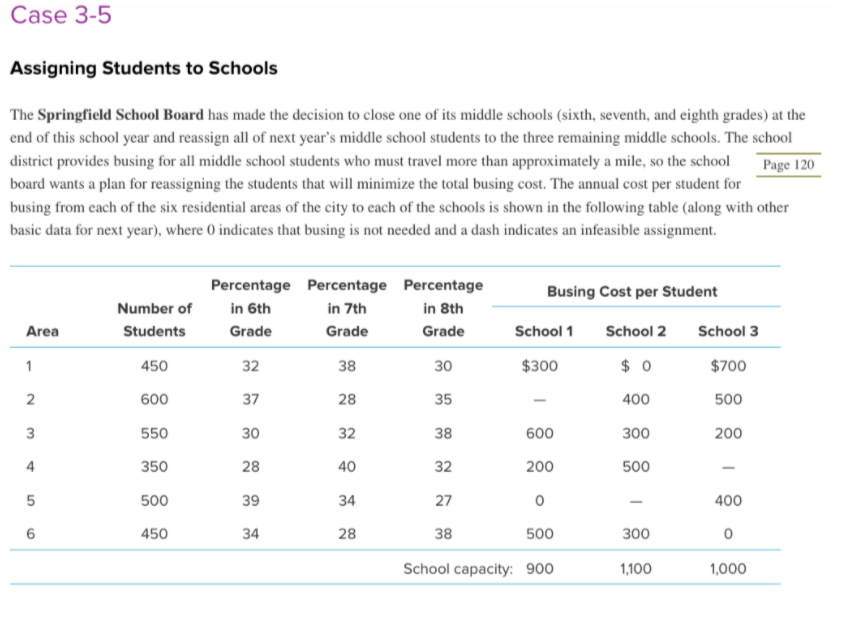
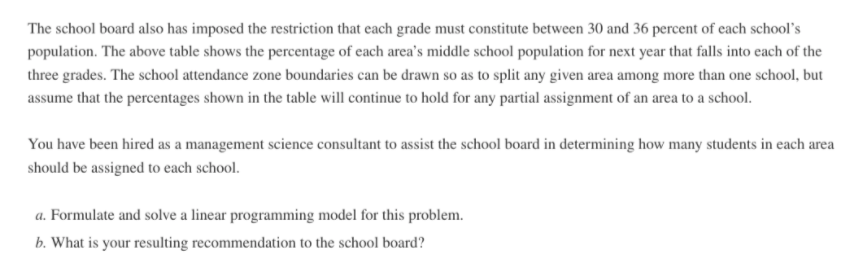
Case 3-5 Assigning Students to Schools The Springfield School Board has made the decision to close one of its middle schools (sixth, seventh, and eighth grades) at the end of this school year and reassign all of next year's middle school students to the three remaining middle schools. The school district provides busing for all middle school students who must travel more than approximately a mile, so the school Page 120 board wants a plan for reassigning the students that will minimize the total busing cost. The annual cost per student for busing from each of the six residential areas of the city to each of the schools is shown in the following table (along with other basic data for next year), where indicates that busing is not needed and a dash indicates an infeasible assignment. Busing Cost per Student Number of Students Percentage Percentage Percentage in 6th in 7th in 8th Grade Grade Grade Area School 2 School 1 $300 School 3 $700 1 450 32 38 30 $ 0 2 600 37 28 35 400 500 3 550 30 32 38 600 300 200 4 350 28 40 32 200 500 5 500 39 34 27 0 400 6 450 34 28 38 500 300 0 School capacity: 900 1,100 1,000 The school board also has imposed the restriction that each grade must constitute between 30 and 36 percent of each school's population. The above table shows the percentage of each area's middle school population for next year that falls into each of the three grades. The school attendance zone boundaries can be drawn so as to split any given area among more than one school, but assume that the percentages shown in the table will continue to hold for any partial assignment of an area to a school. You have been hired as a management science consultant to assist the school board in determining how many students in each area should be assigned to each school. a. Formulate and solve a linear programming model for this problem. b. What is your resulting recommendation to the school boardStep by Step Solution
There are 3 Steps involved in it
Excellent You have provided all the necessary data and uploaded the screenshots Now I will proceed stepbystep exactly as you requested Part A Formulate and Solve the Linear Programming Model 1 Decisio... View full answer

Get step-by-step solutions from verified subject matter experts