

Question: Answer all 3 parts for a thumbs up! M3 - Following are the historical returns for Company A 2014 13.5% 2015 6.3% 2016 -7.5% 2017
 Answer all 3 parts for a thumbs up!
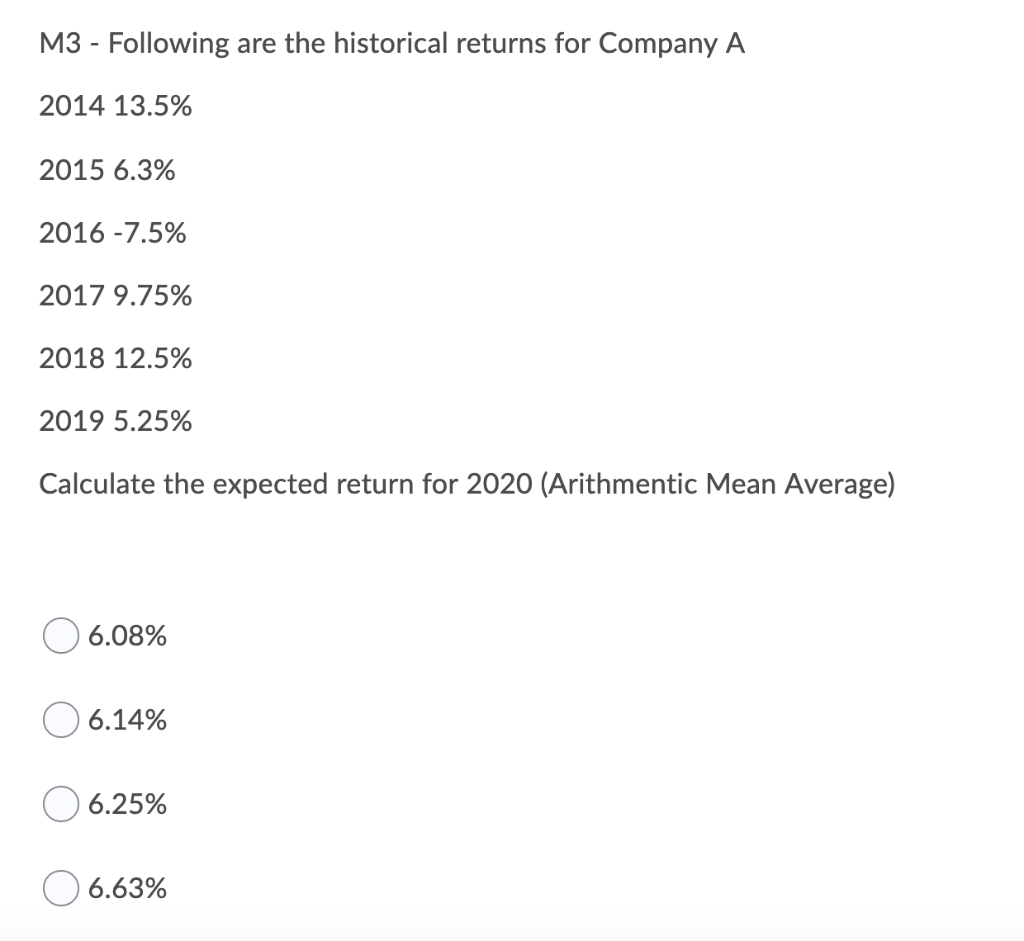
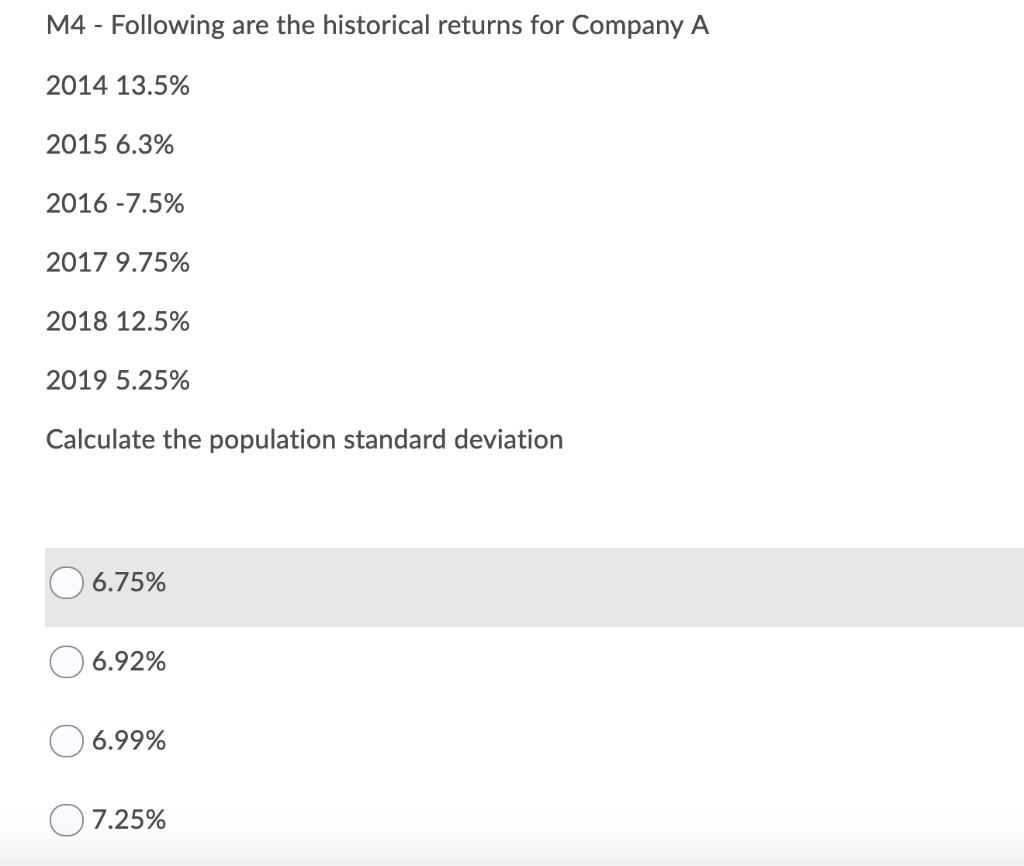
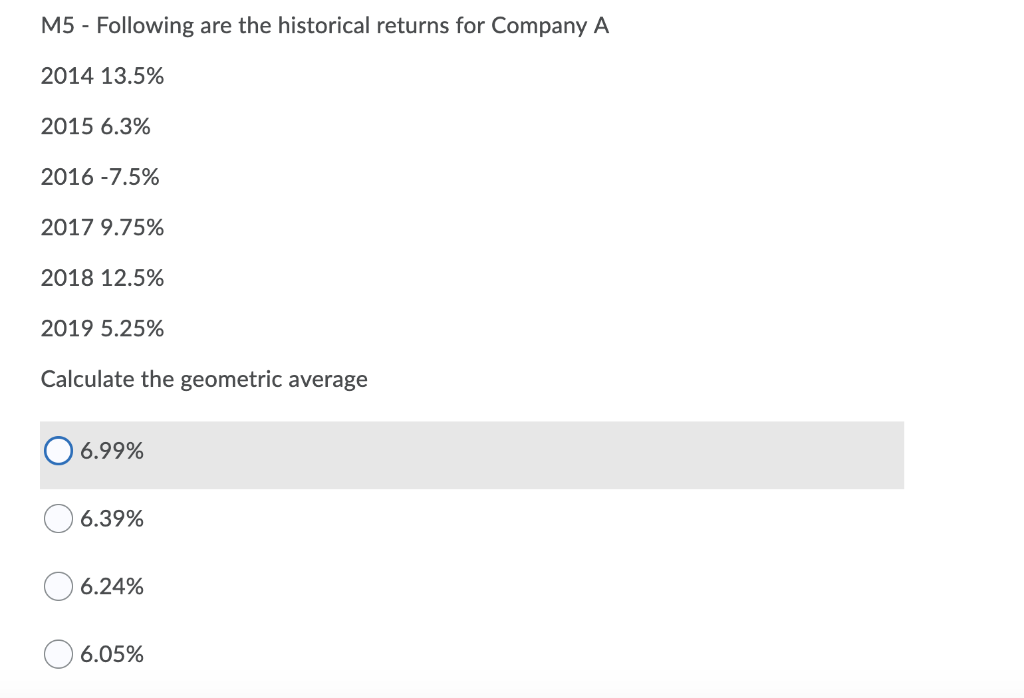
M3 - Following are the historical returns for Company A 2014 13.5% 2015 6.3% 2016 -7.5% 2017 9.75% 2018 12.5% 2019 5.25% Calculate the expected return for 2020 (Arithmentic Mean Average) 06.08% 06.14% O 6.25% 06.63% M4 - Following are the historical returns for Company A 2014 13.5% 2015 6.3% 2016 -7.5% 2017 9.75% 2018 12.5% 2019 5.25% Calculate the population standard deviation O 6.75% 06.92% 06.99% 07.25% M5 - Following are the historical returns for Company A 2014 13.5% 2015 6.3% 2016 -7.5% 2017 9.75% 2018 12.5% 2019 5.25% Calculate the geometric average O 6.99% 06.39% O 6.24% 06.05%
Step by Step Solution
There are 3 Steps involved in it
1 Expert Approved Answer
Step: 1 Unlock

Question Has Been Solved by an Expert!
Get step-by-step solutions from verified subject matter experts
Step: 2 Unlock
Step: 3 Unlock